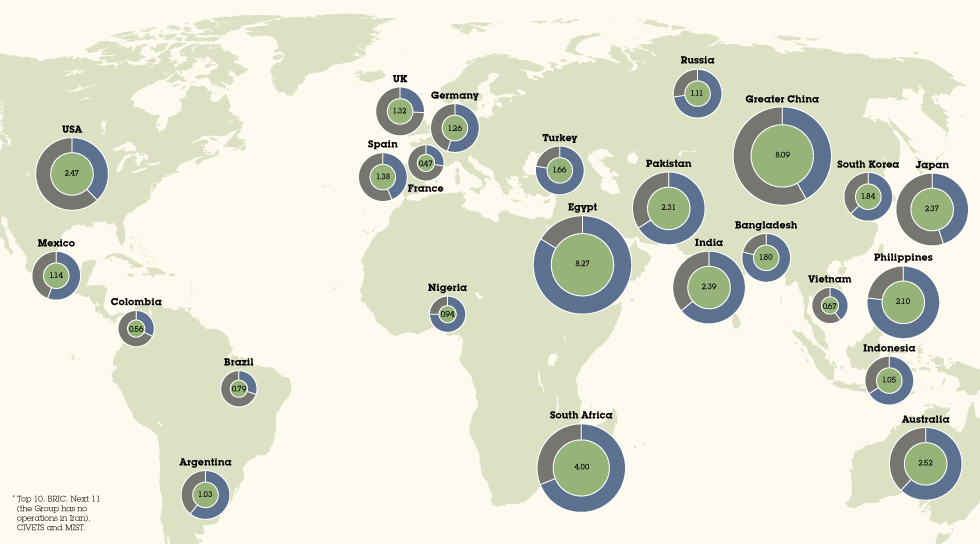
We aim to be a low-carbon, resource efficient group. We support urgent action to tackle global climate change and have targeted a reduction in our own carbon footprint to 1.8 tonnes per person across our locations by 2020. This diagram shows how we are progressing in some of our key markets*. Our carbon footprint variesby market reflecting factors such as our work to improve energy efficiency inour offices; our purchase of electricity from renewable sources; and the carbon intensity of national grids.
Our carbon strategy
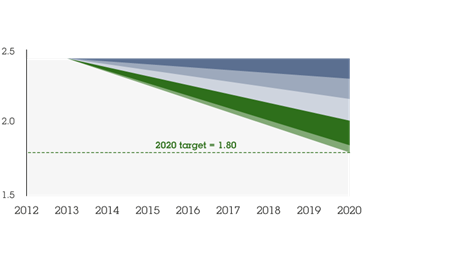
Our goal is to reduce carbon emissions to 1.8 tonnes of CO2e per person by 2020, a 47% reduction from 2006.
Our annual reduction target is 4% and each of our operating companies has its own individual reduction target. We have selected a carbon intensity target per person, as headcount is closely linked to levels of business activity and this allows us to reflect the impact of acquisitions and disposals without needing to adjust our baseline.
Our strategy focuses on:
- Office energy use: Improving building and IT energy efficiency and consolidating office space.
- Air travel: Reducing non-essential flights by promoting videoconferencing. We offset 100% of emissions
from our business air travel by supporting renewable energy generation projects in fast-growing economies.
- Renewable energy: Purchasing renewable electricity for our offices where available.
In 2012, we identified the savings we needed to achieve our target by 2020 for each area of our strategy.
We have made significant progress in 2016 and expect to achieve our target ahead of schedule. As a result,
we will be reviewing this strategy in the coming year.
Carbon strategy 2012-2020
tonnes of CO2e per employee
Carbon strategy 2012-2020, tonnes of CO2e per employee
| |
|
Tonnes per person |
% |
| |
2012 carbon intensity |
2.45 |
|
| |
Building energy efficiency |
-0.14 |
-6% |
| |
Investing in technology at new and existing buildings |
| |
Office space consolidation |
-0.14 |
-6% |
| |
Reducing space requirements in key cities |
| |
IT consolidation |
-0.15 |
-6% |
| |
Moving servers to best-in-class data centres |
| |
Green-tariff electricity |
-0.17 |
-7% |
| |
Increasing supply from 16% to 25% of total electricity use |
| |
Other reductions |
-0.05 |
-2% |
| |
From additional carbon reduction measures to be identified |
| |
2020 carbon intensity target |
1.80 |
-26% |
Performance in 2016
- Carbon footprint per person: 1.86 tonnes of CO2e, down 10% on 2015 and 45% lower than 2006.
- Carbon footprint per £million of revenue: 17.36 tonnes of CO2e, down 20% on 2015 and 62%
lower than 2006.
- Absolute carbon footprint: Down on the previous year at 249,782 tonnes CO2e (2015: 264,774 tonnes CO2e). Since 2006, our absolute carbon footprint has decreased by 7%, compared to a growth in reported headcount of 69% and revenue growth of 144%.
The reduction in our carbon footprint this year is due to a number of factors, including: changes in carbon emissions factors for scope 2 emissions in some countries reflecting an increase in the percentage of lower-carbon and renewable energy used to power national grids; an increase in the amount of Renewable Energy Certificates (RECs) that we purchase in the US, with enough RECs purchased to offset 41% of the electricity used by WPP companies in the US during 2016; improvements in our office energy efficiency and a drop in business air travel.
Carbon footprint in 2016
%
- Stationary fuel combustion 3
- Purchased electricity 47
- Business air travel 37
- Other estimated impacts 13
Carbon intensity 2006-2016
tonnes of CO2e
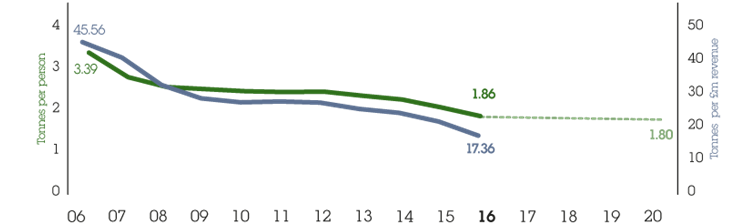
- Headcount intensity
- Target headcount intensity
- Revenue intensity
In 2016, total energy use fell by 4% year-on-year and energy use per person by 9%, largely due to improvements in office energy efficiency and consolidation of office space. Total air travel decreased by 3% year-on-year and air travel per person by 7%. This may be due to cost pressures, for example the impact of exchange rates on the cost of travel as well as an increase in the use of our videoconferencing facilities.
Since 2006, our total energy consumption increased by 10%. However, energy use per person decreased by 35%. As a result, we have avoided £8.3 million in annual utility costs and 103,000 tonnes of CO2e. Total air miles increased by 37% since 2006, but air miles per person decreased by 19%, avoiding over 134 million air miles
and 46,000 tonnes of CO2e annually.
Decoupling emissions from business growth
index (2006 = 100)
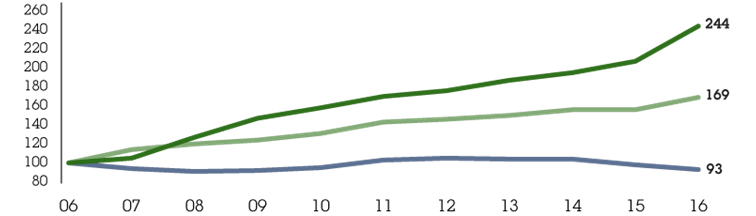
- Revenue
- Headcount
- Emissions
We participate in the CDP Climate Change program, a collaboration of institutional investors encouraging companies to disclose climate change risks and opportunities. We scored A- and were the leading company in our sector for our climate change strategy and reporting. The CDP scoring system changed this year so our score is not directly comparable with our score of 97B in 2015. We also take part, as a responding company, in the CDP Supply Chain program.
Madrid: designing sustainable buildings
The Rios Rosas building designed by BDG architecture + design, a WPP company, will be home to all our agencies in Madrid and has a number of sustainability features. The building will be operational in 2018.
1 Accessibility
City-centre location with both underground rail and bus stops immediately outside the building. Bike storage will be provided for people who cycle to work.
2 Façade
The façade has been carefully engineered using thermal modelling to reduce heat gain and keep the building cool.
3 Workspace
The workspace has been designed to facilitate both individual concentrated work and group collaborative working. The variety and availability of spaces will encourage movement and enhance the potential for chance encounters between people.
4 Auditorium/conference space
The auditorium and conference facilities provide a flexible presentation space to be used for formal or informal presentations or screenings. The equipment and room set-up enables WPP in Madrid to host seminars and broadcast these to other WPP offices, allowing large WPP gatherings to happen virtually.
5 Lighting
The lights are energy-efficient LEDs which are controlled through a central system. Daylight sensors automatically dim the lights depending on the daylight levels.
6 Heating, cooling and ventilation
The central heating and cooling plant has been selected to maximise energy efficiency. Local ventilation units have been used in the office space to minimise the energy lost through the ductwork. A central building management system will monitor the building’s operational uses allowing the equipment to be fine-tuned to operate at maximum efficiency.
7 Solar panels
There are 49 solar hot water panels integrated into the roof, these will provide more than 50% of the building’s hot water demand.
8 Terrace garden
Existing trees have been preserved and complemented with a mixture of low-maintenance landscaping designed to cope with changes in climate.
Building energy use
Half of WPP’s carbon footprint comes from energy used in our offices. Investing in low-carbon, energy-efficient buildings is therefore a key component of our strategy. We also aim to use space more efficiently so we can reduce the overall amount of space we occupy, and therefore the total amount of energy we consume.
When we lease, purchase, t out or renovate a building larger than 50,000 square feet, we require it to be certified to an internationally-recognised green building standard. This includes the US standard LEED (Leadership in Energy and Environmental Design) and the UK standard BREEAM (Building Research Establishment Environmental Assessment Method).
Today, over 4.4 million square feet, 18% of our total floor space, is certified to recognised standards (2015: 16%) against our target of 25% by 2020. We have made steady progress since 2007 when 1% of our floor space was certified to such standards, and have a pipeline of major projects in cities in Europe, Asia and the Americas.
Moves to certified buildings have reduced our energy use by an average of 21% at each location. Recent examples include the new London workspace for Ogilvy and MEC at Sea Containers (BREEAM Excellent) and the WPP Campus in Shanghai (LEED Gold).
Offices below 50,000 square feet must either be certified to recognised green building standards (as described left) or assessed against our own scorecard. This covers five criteria: energy and carbon; water; materials and waste; travel; and health & safety.
Detailed energy use data can help us improve efficiency and reduce energy use. When acquiring or retrofitting buildings, access to energy and other environmental data is one of the factors considered. We aim to integrate this into lease agreements with landlords and/or to install sub-metering.
Office space consolidation includes redesigning offices to use space more efficiently and encouraging flexible working to reduce the overall number of desks needed.
Well-being in our buildings
We aim to design and run our offices in a way that promotes our people’s well-being, looking at factors such as indoor air quality (especially in large congested cities), thermal comfort, lighting levels, noise and acoustics. This
is good for our people and can contribute to productivity. To increase our understanding of healthy buildings, we successfully tested a new methodology in 2016, the WELL Building Standard, at GTB’s new offices in Shanghai.
IT energy use
As part of a major transformation program to improve the efficiency of our IT infrastructure across WPP companies, we have signed a partnership with IBM. The contract was signed at the end of 2014 and includes energy and environmental targets to ensure we realise the potential carbon reduction opportunities from improving IT.
In 2016, we started the complex task of migrating WPP’s server infrastructure to best-in-class external data centres and we aim to transfer up to 4,000 servers by the end of 2017. We are in the process of quantifying the environmental impact of these transfers with preliminary results available in early 2018. We will use these to optimise the migration of the remaining servers in 2018 and 2019.
Our managed print program is being deployed at 35 of our largest locations globally and is expected to reduce paper use by 14% and printer energy use by 63% at these locations.
Renewable energy
We aim to increase our use of electricity generated from renewable sources, including green-tariff electricity contracts. We reached 22% in 2016 (2015: 21%).
We reviewed green-tariff uptake at our 100 largest locations and found that, in many locations, suitable contracts are not available or electricity purchasing is controlled by the landlord. As an alternative, and to help us reach our target of 25% renewable energy, we purchase renewable energy certificates (RECs) in the US, our largest market. Each REC purchased is equivalent to purchasing 1MWh of renewable energy and promotes investment in renewable energy generation. We purchased 23,145 Green-e Energy certified RECs for 2016, working with Renewable Choice Energy, a US-based business providing clean energy products and services. Our use of renewable electricity and our RECs purchases reduces our carbon footprint by 29,941 tonnes of CO2e.
Total renewable electricity purchased
% breakdown
by country 2016
- USA 57
- UK 24
- Germany 9
- Italy 3
- All other countries 7
Air travel, videoconferencing and offsetting
Face-to-face meetings with clients are often essential so, while we cannot eliminate air travel, we can reduce unnecessary flights and use audio and videoconferencing to replace some face-to-face meetings.
We have invested in a videoconferencing network that now incorporates over 720 units in 173 cities worldwide. With the introduction of a new conferencing system and the purchase of 68 new VC units, usage continued to grow in 2016. Our 24-hour, five-day-a-week helpdesk offers support to our people wanting to use the service. We are integrating this service into other online collaboration platforms, enabling us to extend video services to all users within the Group.
Worldwide videoconferencing network
Key cities
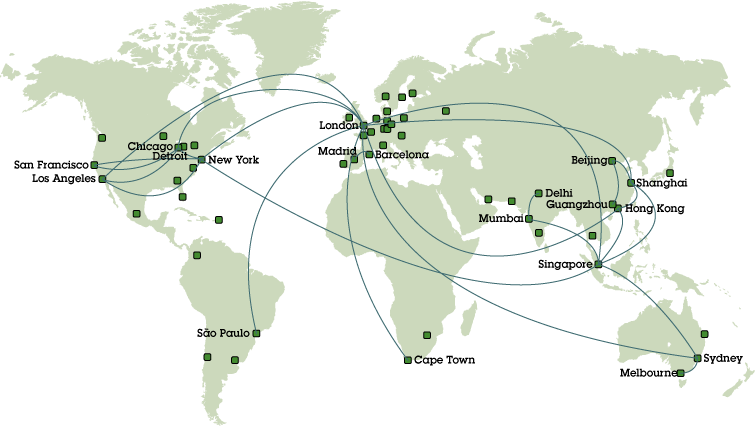
- VC units supported by WPP’s videoconferencing program
- Major air routes
We offset 100% of our air travel emissions by purchasing high-quality carbon credits. We work with South
Pole Group, a company that develops emission-reduction projects. In 2016, we invested £150,000 to support four renewable energy-generation projects in faster-growing economies. Together, these projects generate over 230m kWh of renewable electricity a year and support almost 600 direct jobs. Our operating companies cover the cost of the carbon credits, based on their air travel mileage, which encourages initiatives to reduce air travel.
Since 2007, we have purchased and permanently retired over 1.2 million carbon credits and supported 15 projects. We focus on projects that provide both environmental benefits and support local socio-economic development, see following page for our current projects.
Carbon offsetting projects 2016
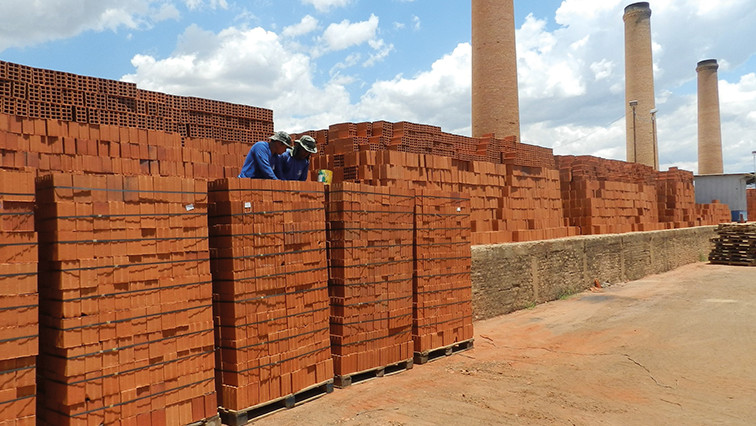
Brazil
Renewable biomass
Ituiutaba
10,000
tonnes of CO2e offset
Project
Ceramic factory running on thermal energy from agricultural waste instead of native forest timber in south-eastern Brazil
Standards
Verified Carbon Standard (VCS)
Social Carbon
WPP coverage
58% of annual credit issuance
Benefits
40 workers with improved working conditions
1,100 students involved in environmental activities
20,500 cubic metres of native forest timber saved per year (over 10,000 trees)
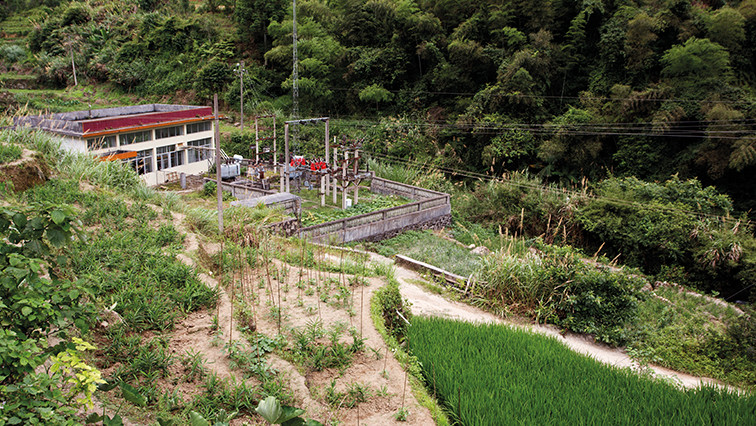
China
Small hydropower
Hezhou III and V
11,266
tonnes of CO2e offset
Project
Six small run-of-river hydropower plants in southern China generating 6m kWh of renewable electricity annually
Standards
Gold Standard
WPP coverage
100% of annual credit issuance
Benefits
30 direct jobs created
Decrease in open fireplaces in households (switch from burning wood for energy to hydroelectricity)
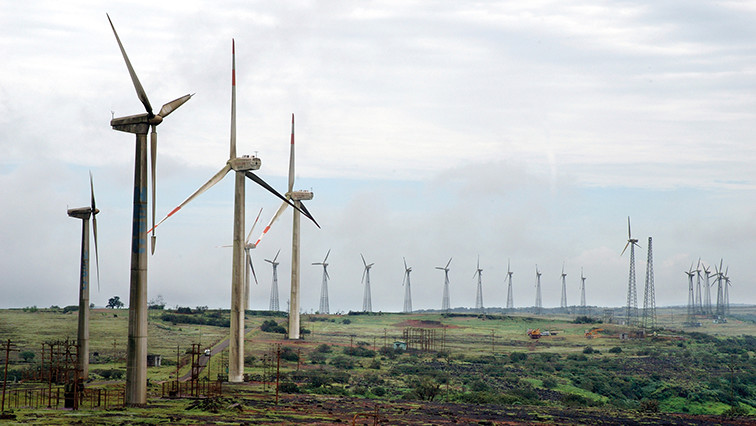
India
Wind power
Mitcon
51,179
tonnes of CO2e offset
Project
138 wind turbines across five regions in western India generating 161m kWh of renewable electricity annually
Standards
Verified Carbon Standard (VCS)
WPP coverage
34% of annual credit issuance
Benefits
450 direct jobs created
9,700 indirect jobs created
4,200 students with improved educational facilities
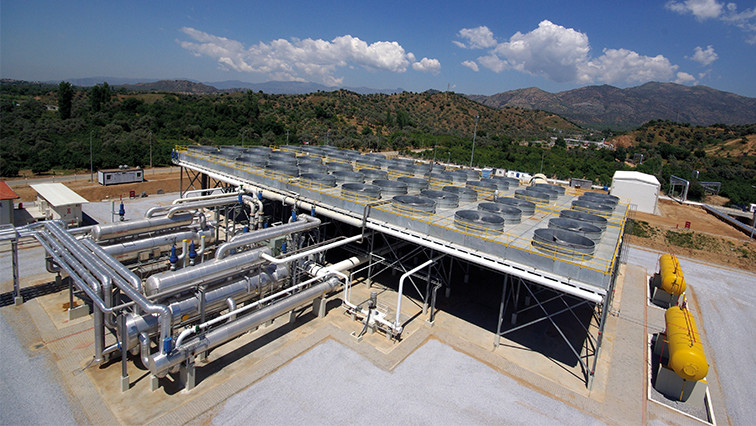
Turkey
Geothermal power
Dora II
20,000
tonnes of CO2e offset
Project
Geothermal plant in western Turkey generating 70m kWh of renewable electricity annually
Standards
Gold Standard
WPP coverage
48% of annual credit issuance
Benefits
117 direct jobs created
732 students with improved educational facilities
About carbon offsetting standards:
Gold Standard – Established in 2003 and endorsed by over 80 NGOs. Used in voluntary and CDM (Clean Development Mechanism) projects. Aims to ensure that projects are both reducing emissions and providing sustainable benefits to local populations.
Social Carbon – Created in 2008 by the Ecologica Institute in Brazil. Assesses the social, environmental and economic performance of projects. Works in conjunction with carbon accounting standards that measure emissions reductions, such as VCS.
Verified Carbon Standard (VCS) – Launched in 2006 and the most widely-used carbon accounting standard for the voluntary carbon offsetting market. Ensures that emissions reductions meet accepted quality standards and are independently verified, uniquely numbered and transparently listed in a central database.
Resource use and waste
We aim to use resources efficiently, reduce waste and reuse and recycle where possible. Many procurement
and waste management decisions are made at operating company level and we encourage our companies
to use preferred supplier partners selected by WPP who offer products and services with improved
environmental credentials.
Paper
As an office-based business, paper use is one of our most significant resource impacts and we have set a target to purchase 80% sustainably-sourced paper by 2020. This includes paper with recycled content and paper certified to recognised sustainability standards such as FSC and PEFC. We sourced 23% in 2016.
During 2016, we continued working with our largest paper users, including companies purchasing paper on behalf of clients, to implement our approach.
Our total paper usage in 2016 was 4,460 tonnes (2015: 4,897 tonnes). Our managed print program (see IT energy use on page 64) helps us to reduce paper use by up to 40% per location. We are working to improve
the accuracy of our data in this area.
Paper purchased
%
- Paper with recycled and/or
certified content 23
- Other paper 77
Water
We do not use significant volumes of water and, as an office-based company, water use is not a material issue for WPP. However, we recognise that water scarcity is a major challenge in some regions of the world and we aim to use water carefully.
We estimate that our total water use is around 1.9 million cubic metres, equivalent to 14.8 cubic metres per person per year. This is based on data from external benchmarks and the results of a previous pilot project we ran at 11 offices in areas of water scarcity.
We provide guidance for our offices, available on our intranet, on reducing water use by identifying and repairing leaks; upgrading water fixtures and fittings during renovations; and reusing rainwater and wastewater where feasible. We integrate water conservation into our property acquisition and refurbishment process, see Building energy use.
Waste
Our main types of waste are electronic waste and office consumables such as paper, card, cans, plastic bottles and toner cartridges. We look for opportunities to reduce waste and increase recycling, working with landlords in our leased properties. To encourage recycling among our companies, we have identified preferred supplier partners of recycling services for paper, standard office consumables and mobile phones in all major markets.
In 2016, we estimate the Group generated 10,233 tonnes of waste (2015: 8,772 tonnes) of which 60% was recycled (2015: 65%). The remaining 40% was disposed via landfill or incineration. We are working to improve our data collection on waste and recycling but have further to go to improve data quality.
We recycled 6,122 tonnes of waste in 2016 (2015: 5,713 tonnes), of which 73% was paper and cardboard.
Management of electronic waste is a particular priority for WPP. Our policy is that obsolete IT equipment should be refurbished and sold for reuse, or if this is not possible, be broken down for recycling. Disposal is a last resort, and must be done in compliance with local environmental regulations and data security best practice. As part of our IT Transformation program, our main contractor IBM is working to increase reuse and safe recycling of old IT equipment.
Waste recycled
%
- Recycled waste: 60
- Non-recycled waste: 40
- Paper and cardboard 73
- Other waste 25
- IT equipment 2
Our wider carbon impact
As well as managing our direct greenhouse gas emissions, we can influence indirect emissions associated with our business activities – our value chain emissions. Our analysis shows there are opportunities to work with clients and supplier partners to reduce value chain emissions, for example, those connected with client media plans and other parts of our supply chain.
Carbon emissions across our value chain
%
- Advertising we place
for clients 81
- Goods and services
we buy 15
- Day-to-day activities 4
Our value chain footprint in the UK is around 1.2 million tonnes of CO2e. Our main sources of emissions are:
- Advertising we place for clients: Emissions from the physical dissemination of advertising through press, TV, radio, internet and outdoor channels. See chart below.
- Goods and services we buy: Emissions associated with the goods and services we buy from supplier partners to create marketing campaigns for clients and to run our business. For example, emissions from travel to an advertising shoot or emissions associated with manufacturing the ICT equipment used in our offices.
- Day-to-day activities (direct emissions): Emissions associated with running our business including office energy use, business air travel, commuting and waste. With the exception of commuting, these emissions are covered by our current carbon strategy and target.
We are developing a carbon metric for GroupM, our media investment management business, to use in its media plans, and exploring how we can work with clients to reduce the carbon footprint of media campaigns.
In 2017, we are adding a carbon dashboard to our procurement spend analytics system that identifies more carbon-intensive supplier partners and categories of spend. This will help procurement teams consider carbon impacts in their decision-making.
The carbon impact of the advertising we place for clients
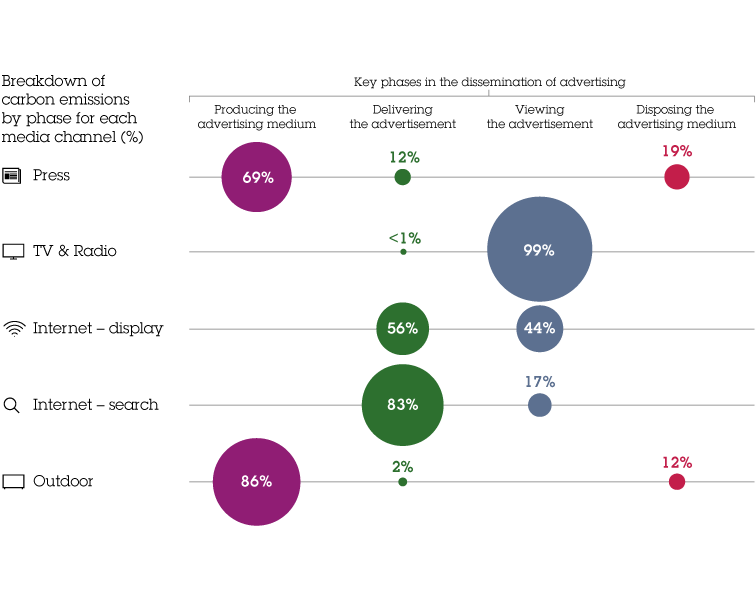
What we’ve included in our analysis:
- Emissions from the manufacturing and printing of paper used for newspaper and billboards advertisements.
- Emissions from the energy used to transmit TV and radio advertisements, to transfer advertisement data over the internet, and to deliver newspaper and billboard advertisements.
- Emissions from the energy used to view and/or listen to the advertisement on a TV/radio, smartphone, tablet or computer.
- Emissions from the disposal of newspaper and billboard advertisements.
Carbon emissions statement 2016
This data covers the year ended 31 December 2016 in line with the Group’s financial reporting period.
Emissions breakdown (in tonnes CO2e)
Emissions breakdown (in tonnes CO2e)
| Emission source |
Base year |
| 2016 |
2015 |
2014 |
2013 |
2012 |
2011 |
2006 |
| Scope 1 |
Natural gas combustion |
6,617 |
6,677 |
7,203 |
8,757 |
7,584 |
7,486 |
1,946 |
| Heating oil combustion |
1,234 |
1,458 |
2,546 |
2,548 |
2,256 |
2,228 |
682 |
| Total scope 1 emissions |
7,851 |
8,135 |
9,748 |
11,305 |
9,840 |
9,714 |
2,628 |
| Scope 2 |
Total purchased electricity at grid average intensity (gross) |
146,846 |
153,798 |
159,540 |
157,471 |
164,212 |
152,968 |
149,728 |
| Less purchases of renewable electricity (see note 6) |
29,941 |
30,580 |
21,192 |
21,299 |
23,765 |
22,572 |
0 |
| Total scope 2 emissions (net) |
116,905 |
123,218 |
138,348 |
136,171 |
140,446 |
130,396 |
149,728 |
| Scope 3 |
Business air travel |
92,445 |
98,885 |
96,590 |
95,879 |
96,080 |
100,961 |
81,714 |
| Other estimated scope 3 emissions (see note 4) |
32,581 |
34,536 |
36,703 |
36,503 |
36,955 |
36,161 |
35,111 |
| Total scope 3 emissions |
125,026 |
133,421 |
133,293 |
132,382 |
133,034 |
137,121 |
116,825 |
| |
Total CO2e emissions (net) |
249,782 |
264,774 |
281,389 |
279,859 |
283,321 |
277,231 |
269,181 |
| |
Total CO2e emissions (gross) |
279,723 |
295,354 |
302,581 |
301,158 |
307,086 |
299,803 |
269,181 |
Carbon intensity (in tonnes of CO2e)
Carbon intensity (in tonnes of CO2e)
| Intensity metric |
Base year |
| 2016 |
2015 |
2014 |
2013 |
2012 |
2011 |
2006 |
| Tonnes per person (net) |
1.86 |
2.07 |
2.28 |
2.35 |
2.45 |
2.44 |
3.39 |
| Percentage change from 2006 |
-45% |
-39% |
-33% |
-31% |
-28% |
-28% |
– |
| Tonnes per £m of revenue (net) |
17.36 |
21.64 |
24.41 |
25.40 |
27.31 |
27.66 |
45.56 |
| Percentage change from 2006 |
-62% |
-53% |
-46% |
-44% |
-40% |
-39% |
– |
Office energy use (in megawatt hours)
Office energy use (in megawatt hours)
| Energy type |
Base year |
| 2016 |
2015 |
2014 |
2013 |
2012 |
2011 |
2006 |
| Direct energy use
(natural gas and heating oil) |
37,174 |
38,287 |
44,847 |
52,532 |
45,673 |
45,090 |
12,099 |
| Indirect energy use
(purchased electricity) |
301,863 |
315,731 |
314,773 |
328,374 |
323,582 |
307,245 |
295,396 |
| Total energy use |
339,037 |
354,018 |
359,620 |
380,906 |
369,255 |
352,335 |
307,495 |
| % of electricity from renewable sources |
22% |
21% |
14% |
15% |
16% |
16% |
– |
Notes to carbon emissions statement 2016
1. Reporting standard
Our carbon emissions statement 2016 has been prepared in accordance with the World Resource Institute (WRI) and World Business Council for Sustainable Development (WBCSD) Greenhouse Gas Protocol: A Corporate Accounting and Reporting Standard, Revised Edition (the GHG Protocol).
2. Greenhouse gases
All greenhouse gases emissions figures are in metric tonnes of carbon dioxide equivalents (CO2e). They include three of the six greenhouse gases covered by the Kyoto Protocol – carbon dioxide (CO2), methane (CH4) and nitrous oxide (N2O). Per fluorocarbons (PFCs), hydro fluorocarbons (HFCs) and sulphur hexafluoride (SF6) emissions have been omitted from our reporting as they are not a material source of greenhouse gases for WPP.
3. Organisational boundary
Emissions data is included for all operations for which WPP and its subsidiaries have operational control. This covers 134,000 people. Associate companies are excluded.
4. Operational boundary
We include the following emissions in our reporting:
- Direct emissions (scope 1): Direct emissions (scope 1): Fuel used to heat WPP premises (combustion of natural gas and heating oil).
- Indirect emissions (scope 2): All purchased electricity, including electricity purchased at grid average carbon intensity, purchased heat and steam, and renewable electricity purchased under specific contractual instruments, such as green-tariff contracts with supplier partners and energy attribute certificates (e.g. renewable energy certificates in the US or guarantees of origin in
the EU).
- Other indirect emissions (scope 3): Business air travel and an estimate for other scope 3 emissions that we do not currently measure on a global basis, including emissions from leased cars, taxis and couriers. This estimate is an additional 15% that we add to our carbon footprint and is shown under ‘other estimated scope 3 emissions’.
5. Geographic scope
Our CO2e emissions data covers our worldwide operations.
6. Emission factors
CO2e emissions have been calculated on the basis of measured or estimated energy use, fuel use and miles travelled, multiplied by the relevant carbon emission factors. In 2016, we updated our emission factors for scope 2 and scope 3 emissions, and our data is based on the following emissions factors:
Emission factors
| Emission scope |
Emission factors used |
Scope 1
(fuel used to heat WPP premises) |
IPCC 2006 Guidelines for National Greenhouse Gas Inventories (using global warming potentials from the 2007 IPCC Fourth Assessment Report). |
Scope 2
(purchased electricity) |
– For the US: US Environmental Protection Agency eGRID 2014 (released in August 2016)
– For the UK: UK Department for Environment, Food & Rural Affairs (Defra), GHG Conversion Factors for Company Reporting (2016)
– For all other countries: International Energy Agency, CO2 Emissions from Fuel Combustion, 2016 Edition
|
Scope 3
(business air travel) |
UK Department for Environment, Food & Rural Affairs (Defra), GHG Conversion Factors for Company Reporting (2016). |
When calculating our carbon footprint, we rate purchased renewable electricity as zero emissions to account for WPP’s use of renewable electricity. We follow the market-based method of the revised version of the GHG Protocol Scope 2 Guidance. For full transparency, we also disclose total electricity purchased at grid average carbon intensity according to the location-based method of the Guidance mentioned above.
7. Data collection methodology
Data used to calculate CO2e emissions is collected quarterly through WPP’s financial reporting system, and includes some estimated data (e.g. in some locations electricity usage is estimated based on headcount or floor space). In 2016, our data covered 98% of our operations by headcount. The remaining 2% was extrapolated based on the Group’s total headcount at year-end.
8. External assurance
Our carbon data is reviewed by Bureau Veritas, an independent assurance provider. Following its review of our 2015 data, Bureau Veritas made a number of recommendations for improving our approach. We
have implemented many of these in our 2016 reporting process. This includes enhancements to our sustainability data collection system to facilitate the ease and accuracy of data submission for our companies. See the Independent Verification Statement.