Climate change and our business
Climate change is a major threat to global social and economic development. We support urgent action to tackle climate change through the Paris Agreement. We have been working to cut our carbon footprint since 2006.
Taking action on climate change reduces risks to our business. It cuts costs associated with energy use and travel; enables us to comply with the environmental requirements in client tender processes; supports employee engagement; and strengthens our credibility as advisors to clients on sustainability communications.
Governance and risk management
Paul Richardson, Group finance director, has overall responsibility for our climate change strategy and risk management. He gives an annual assessment of sustainability risks and opportunities (including climate change) and performance to the Board.
Climate change-related risks are integrated into our overall risk management processes. Performance and updated risk implications are reviewed by the Audit Committee on a bi-annual basis. Assessment of risk is informed by feedback from investors, clients and our people. Types of risk considered include potential for increased regulatory requirements, financial risks associated with energy costs, reputational risks, physical risks (i.e. weather-related) to our offices, and the opportunities to advise our clients on sustainability strategy and communications and low-carbon products. We are analysing how the transition to a low-carbon economy in line with the Paris Agreement may affect our client base and the potential impact on WPP.
We support the Task Force on Climate-related Financial Disclosures and aim to develop our disclosures in line with the Task Force’s recommendations.
We estimate the cost to society from our emissions to be £5.3 million. See Quantifying our impacts.
Our carbon strategy
We work to reduce our carbon emissions through a focus on:
- Office energy use: Improving the energy efficiency of our buildings and IT, and consolidating our office space.
- Air travel: Reducing non-essential flights by promoting videoconferencing. We offset 100% of emissions from our business air travel.
- Renewable energy: Increasing the proportion of renewable electricity purchased.
Our target was to reduce carbon emissions to 1.8 tonnes of CO2e per person by 2020, a 47% reduction on our 2006 baseline. We also have an annual reduction target of 4%. We use a carbon intensity target per person, as headcount is closely linked to levels of business activity and this allows us to reflect the impact of acquisitions and disposals without needing to adjust our baseline.
We have met our target ahead of schedule and will set a new target during 2018. We aim to align our target with climate science and the requirements of the Science Based Targets Initiative.
We participate in the CDP Climate Change program, a collaboration of institutional investors, and scored B in 2017 for our climate strategy and reporting (2016: A-). The drop in our rating this year is due to a lower score for our responses to the CDP questions on climate-related risk assessment. In 2018, we will be doing further work in this area, extending the scope of our risk assessment in line with the TCFD recommendations.
Decoupling emissions from business growth Index (2006 = 100)
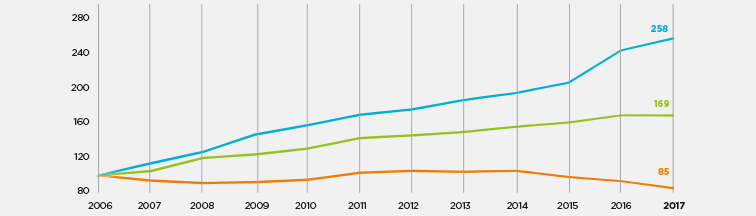
- Emissions
- Headcount
- Revenue
Carbon intensity 2006-2017
tonnes of CO2e
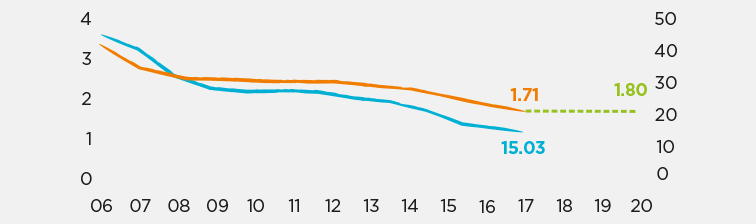
- Headcount intensity
- Revenue intensity
- Target headcount
intensity
Performance in 2017
We reduced our carbon footprint per person by 8% year-on-year and by 50% against our 2006 baseline. We also reduced our carbon footprint per £million revenue by 13% year-on-year and by 67% compared with 2006.
Since 2006, we have reduced absolute carbon emissions by 39,800 tonnes, a 15% reduction.
The reduction in our carbon footprint this year is due to improvements in office energy consumption, an increase in the proportion of energy purchased from renewable sources including renewable energy certificates (RECs) and a reduction in business air travel. Changes in scope 2 carbon emissions factors reflecting a global increase in renewable energy generation have also had an impact.
Our energy use decreased by 3% year-on-year due to improvements in office energy efficiency and consolidation of office space. Since 2006, our total energy use has increased by 7% but energy use per person has fallen by 37%.
Air travel fell by 4% year-on-year (total miles travelled and miles per person). This may be due to cost controls as well as an increase in the use of our videoconferencing facilities. Since 2006, total miles travelled have increased by 32% but miles per employee has fallen by 22%.
Carbon footprint in 2017 %
- Stationary fuel combustion3%
- Purchased electricity45%
- Business air travel39%
- Other estimated impacts13%
Building and IT energy use
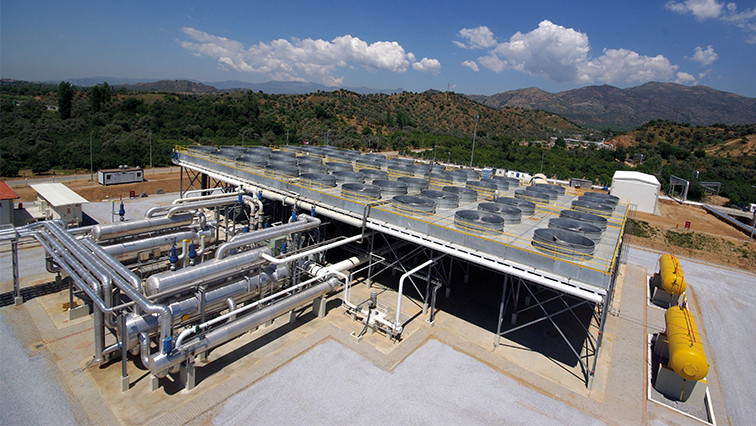
We invest in low-carbon, energy-efficient office buildings. We are also consolidating our offices, aiming to use space more efficiently and encourage collaboration between our companies. When we lease, purchase, fit out or renovate a building larger than 50,000 square feet, we require it to be certified to an internationally-recognised green building standard. This includes the US standard LEED and the UK standard BREEAM. We estimate this reduces energy use by around 21% per location.
Offices below 50,000 square feet must either be certified or assessed against our own scorecard covering energy and carbon; water; materials and waste; travel; and health & safety.
Today, over 4.7 million square feet, 20% of our total floor space, is certified to recognised standards (2016: 18%) against our target of 25% by 2020. We have made steady progress since 2007 when 1% of our floor space was certified, and have a pipeline of major projects in cities in Europe, Asia and the Americas.
We aim to design and run our offices in a way that promotes our people’s well-being, looking at factors such as indoor air quality (especially in large congested cities), thermal comfort, lighting levels, noise and acoustics. This is good for our people and can contribute to increased productivity. To improve our understanding of healthy buildings, we successfully tested the WELL Building Standard at our operating company GTB’s new offices in Shanghai. We aim to follow this standard for major projects.
Our managed print program is being deployed at 56 of our largest locations globally and is expected to reduce paper use by 15% and printer energy use by 61% at these locations.
Renewable energy
We increased the percentage of electricity purchased from renewable sources to 26% (2015: 22%), exceeding our 25% target.
In some of our locations it is not possible to purchase electricity via green-tariff contracts. As an alternative, we purchase renewable energy certificates (RECs) in the US, our largest market. Each REC purchased is equivalent to purchasing 1MWh of renewable energy and promotes investment in renewable energy generation.
We purchased 34,900 Green-e Energy certified RECs for 2017, enough to offset 49% of the electricity used by WPP companies in the US. We work with Renewable Choice Energy, a US-based business providing clean energy products and services.
Total renewable electricity purchased % breakdown by country 2017
- USA 59%
- UK 20%
- Germany 7%
- Italy 5%
- All other countries 8%
Air travel and offsetting
We aim to reduce unnecessary business travel and use audio and videoconferencing to replace some face-to-face meetings.
Our videoconferencing network now incorporates over 700 units in 155 cities worldwide. We are integrating the system into our online collaboration platforms, enabling us to extend video services to all users within the Group.
We cannot eliminate air travel since face-to-face meetings are often essential to our work with clients. We offset 100% of our remaining air travel emissions by purchasing high-quality carbon credits. We work with South Pole Group, a company that develops emission- reduction projects. In 2017, we invested over £150,000 to support four renewable energy-generation projects in faster-growing economies. Together, these projects generate over 380m kWh of renewable electricity a year and create social benefits including around 400 direct jobs. For example, we are supporting a wind power project in India which generates 268 kWh a year. The project has created 210 jobs during construction and 150 permanent roles.
Our operating companies cover the cost of the carbon credits, based on their air travel mileage, which encourages initiatives to reduce air travel. Since 2007, we have purchased and permanently retired almost 1.4 million carbon credits.
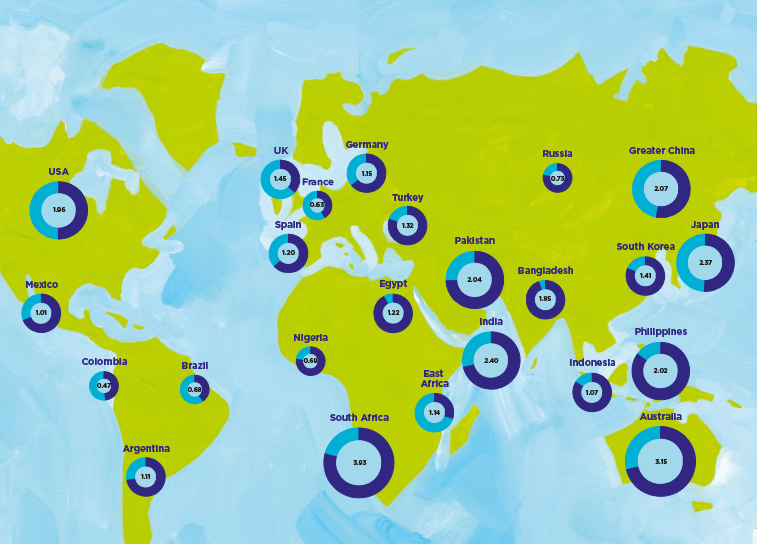
Environmental impact
We aim to be a low-carbon, resource efficient group. Our carbon footprint varies by market reflecting factors such as our work to improve energy efficiency in our offices; our purchase of electricity from renewable sources; and the carbon intensity of national grids. This map shows our progress in some of our key markets. The size of each pie chart is relative to the carbon footprint per person in each country.
Green buildings case study
New green building for WPP Amsterdam
The Rivierstaete building in Amsterdam will soon be home to 20 WPP companies. The new offices are being designed by WPP company, BDG architecture + design, with a range of sustainability features and are expected to achieve a ‘Very Good’ rating under BREEAM.
The building will provide 20,300sqm of contemporary workspace, catering and meeting facilities. Comfort and energy efficiency have been a priority throughout the design. The building is fitted with external blinds that automatically rise and fall to maximise natural daylight and prevent overheating. Green roofs and planted terrace areas will help to reduce rain water run-off while providing an attractive environment for colleagues.

Inside, intelligent LED lighting will automatically dim the lights depending on daylight levels .The building is also provided with a water source heat pump system connected to boreholes, to provide for some of the building's heating and cooling needs.
Carbon offsetting projects 2017
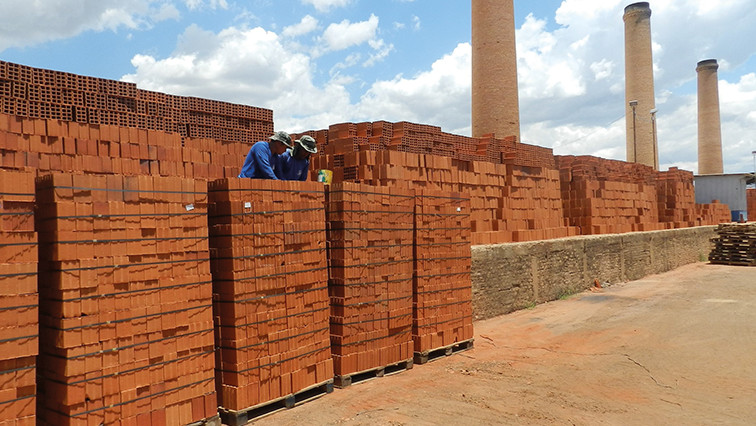
Brazil
Renewable biomass
Ituiutaba
10,121
tonnes of CO
2e offset
Project
Ceramic factory running on thermal energy from agricultural waste instead of native forest timber in south-eastern
Brazil
Standards
Gold Standard
WPP coverage
59% of annual credit issuance
Benefits
40 workers with improved working conditions
1,100 students involved in environmental activities
20,500 cubic metres of native forest timber saved per year (over 10,000 trees)
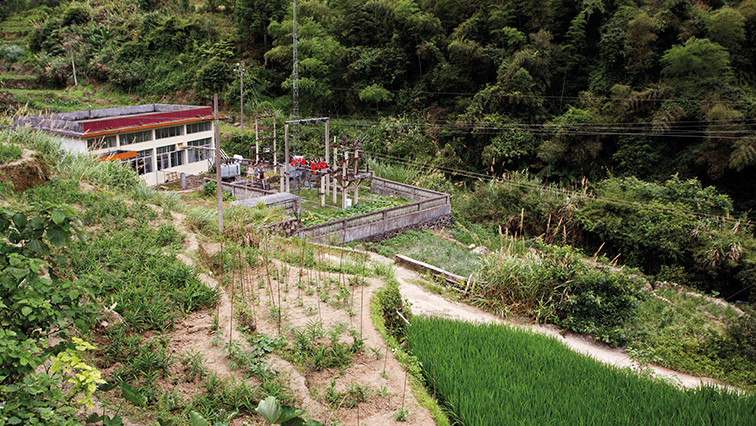
China
Small hydropower
Hezhou III and V
18,121
tonnes of CO
2e offset
Project
Six small run-of-river hydropower plants in southern China generating 12m kWh of renewable electricity annually
Standards
Gold Standard
WPP coverage
100% of annual credit issuance
Benefits
59 direct jobs created
Decrease in open fireplaces in households (switch from burning wood for energy to hydroelectricity)
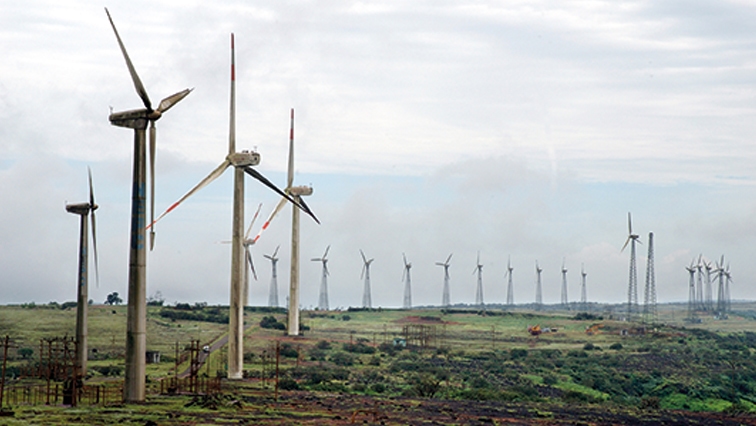
India
Wind power
Mytrah
41,276
tonnes of CO
2e offset
Project
Wind farm in India generating 268m kWh of renewable electricity annually
Standards
Verified Carbon Standard (VCS)
WPP coverage
16% of annual credit issuance
Benefits
150 direct jobs created, as well as 210 jobs during its construction.
291 girls receiving secondary coaching and certification
3,207 patients successfully treated through the project clinic
Turkey
Geothermal power
Dora II
20,000
tonnes of CO
2e offset
Project
Geothermal plant in western Turkey generating 79m kWh of renewable electricity annually
Standards
Gold Standard
WPP coverage
43% of annual credit issuance
Benefits
117 direct jobs created
732 students with improved educational facilities
About carbon offsetting standards:
Gold Standard – Established in 2003 and endorsed by over 80 NGOs. Used in voluntary and CDM (Clean Development
Mechanism) projects. Aims to ensure that projects are both reducing emissions and providing sustainable
benefits to local populations.
Social Carbon – Created in 2008 by the Ecologica Institute in Brazil. Assesses the social, environmental and
economic performance of projects. Works in conjunction with carbon accounting standards that measure emissions
reductions, such as VCS.
Verified Carbon Standard (VCS) – Launched in 2006 and the most widely-used carbon accounting standard for the
voluntary carbon offsetting market. Ensures that emissions reductions meet accepted quality standards and are
independently verified, uniquely numbered and transparently listed in a central database.
Resource use and waste
We aim to use resources carefully, to reduce waste and to recycle as much as possible. To assist our companies, we have identified preferred supplier partners for recycling services in all major markets. We work with landlords on waste management in our leased properties.
In 2017, we estimate the Group generated 10,696 tonnes of waste (2016: 10,233) of which 54% was recycled. The remaining 46% was disposed of via landfill or incineration. We are working to improve our data collection on waste and recycling but have further to go to improve data quality.
Our main waste types are electronic waste and office consumables (eg paper, card, cans, plastic bottles and toner cartridges).
Paper
As an office-based business, paper use is one of our most significant resource impacts and we have set a target to purchase 80% sustainably-sourced paper by 2020. This includes paper with recycled content and paper certified to recognised sustainability standards such as FSC and PEFC. We are not on track to meet our target, sourcing 23% in 2017 (2016: 23%).
Our total paper usage in 2017 was 3,597 tonnes (2016: 4,460 tonnes). Our managed print program (see IT energy use) helps us to reduce paper use.
Our wider carbon impact
As well as managing our direct greenhouse gas emissions, we can have an influence on indirect emissions associated with our
business activities – our value chain (scope 3) emissions.
To help us prioritise our efforts, we have analysed our value chain emissions using data from the UK. This showed that our
main sources of greenhouse gas emissions are:
-
Day-to-day activities (direct emissions): Emissions associated with running our business including office
energy use, business air travel, commuting and waste. With the exception of commuting, these emissions are covered
by our current carbon strategy and target.
-
Goods and services we buy: Emissions associated with the goods and services we buy from supplier partners
to create marketing campaigns for clients and to run our business.
-
Advertising we place for clients: Emissions from the physical dissemination of advertising through
press, TV, radio, internet and outdoor channels.
We are exploring how we can work with clients to reduce the carbon footprint of media campaigns.
We aim to work with supplier partners in more carbon-intensive industries to improve their reporting and performance.
Carbon emissions across our value chain %
- Advertising we place
for clients 81
- Goods and services
we buy 15
- Day-to-day activities 4
The carbon impact of the advertising we place for clients
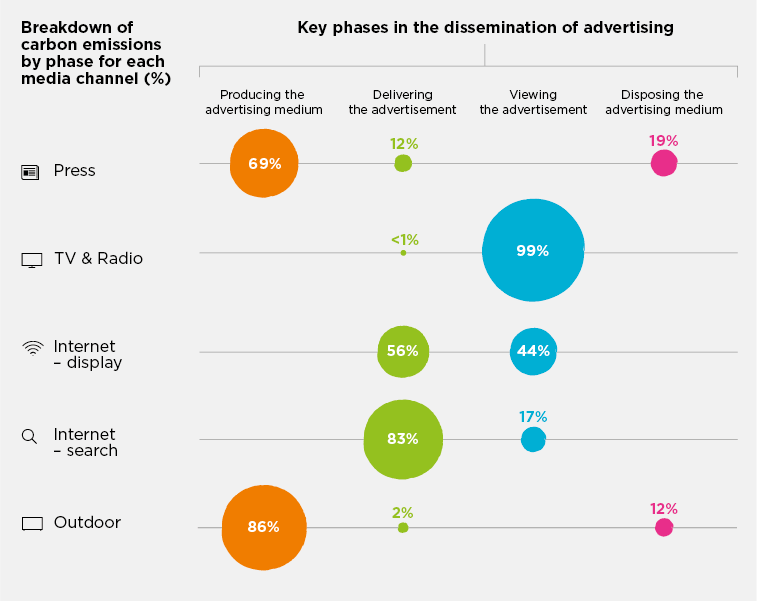
- Emissions from the manufacturing and printing of paper used for newspaper and billboards advertisements.
- Emissions from the energy used to transmit TV and radio advertisements, to transfer advertisement data over the internet, and to deliver newspaper and billboard advertisements.
- Emissions from the energy used to view and/or listen to the advertisement on a TV/radio, smartphone, tablet or computer.
- Emissions from the disposal of newspaper and billboard advertisements.
Carbon emissions statement 2017
CO2e emissions breakdown (in tonnes of CO2e)
Emissions breakdown (in tonnes CO2e)
| Emission source |
Base year |
| 2017 |
2016 |
2015 |
2014 |
2013 |
2006 |
| Scope 1 |
Natural gas combustion |
6,602 |
6,617 |
6,677 |
7,203 |
8,757 |
1,946 |
| Heating oil combustion |
1,046 |
1,234 |
1,458 |
2,546 |
2,548 |
682 |
| Total scope 1 emissions |
7,648 |
7,851 |
8,135 |
9,749 |
11,305 |
2,628 |
| Scope 2 |
Total purchased electricity at grid average intensity (gross) |
130,947 |
144,962 |
153,798 |
159,540 |
157,471 |
149,728 |
| Total purchased heat & steam |
1,963 |
1,884 |
- |
- |
- |
- |
| Less purchases of renewable electricity (see note 6) |
30,586 |
29,941 |
30,580 |
21,192 |
21,299 |
- |
| Total scope 2 emissions (net) |
102,324 |
116,905 |
123,218 |
138,348 |
136,171 |
149,728 |
| Scope 3 |
Business air travel |
89,518 |
92,445 |
98,885 |
96,590 |
95,879 |
81,714 |
| Other estimated scope 3 emissions (see note 4) |
29,924 |
32,581 |
34,536 |
36,703 |
36,503 |
35,111 |
| Total scope 3 emissions |
119,442 |
125,026 |
133,421 |
133,293 |
132,382 |
116,825 |
| |
Total CO2e emissions (net) |
229,414 |
249,782 |
264,774 |
281,389 |
279,859 |
269,181 |
| |
Total CO2e emissions (gross) |
260,000 |
279,723 |
295,354 |
302,581 |
301,158 |
269,181 |
WPP’s carbon intensity (in tonnes of CO2e)
Carbon intensity (in tonnes of CO2e)
| Intensity metric |
Base year |
| 2017 |
2016 |
2015 |
2014 |
2013 |
2006 |
| Tonnes per person (net) |
1.71 |
1.86 |
2.07 |
2.28 |
2.35 |
3.39 |
| Percentage change from 2006 |
(50%) |
(45%) |
(39%) |
(33%) |
(31%) |
– |
| Tonnes per £m of revenue (net) |
15.03 |
17.36 |
21.64 |
24.41 |
25.40 |
45.56 |
| Percentage change from 2006 |
(67%)
|
(62%) |
(53%) |
(46%) |
(44%) |
– |
Office energy use (in megawatt hours)
Office energy use (in megawatt hours)
| Energy type |
Base year |
| 2017 |
2016 |
2015 |
2014 |
2013 |
2006 |
| Direct energy use
(natural gas and heating oil) |
36,415 |
37,174 |
38,287 |
44,847 |
52,532 |
12,099 |
| Indirect energy use
(purchased electricity, heat & steam) |
293,463 |
301,863 |
315,731 |
314,773 |
328,374 |
295,396 |
| Total energy use |
329,878 |
339,037 |
354,018 |
359,620 |
380,906 |
307,495 |
| % of electricity from renewable sources |
26% |
22% |
21% |
14% |
15% |
0% |
Notes to carbon emissions statement 2017
1. Reporting standard
Our carbon emissions statement 2017 has been prepared in accordance
with the World Resource Institute (WRI) and World Business Council
for Sustainable Development (WBCSD) Greenhouse Gas Protocol:
A Corporate Accounting and Reporting Standard, Revised Edition
(the GHG Protocol).
2. Greenhouse gases
All greenhouse gases emissions figures are in metric tonnes of carbon dioxide equivalents (CO2e). They include three of the six greenhouse gases covered by the Kyoto Protocol – carbon dioxide (CO2), methane (CH4) and nitrous oxide (N2O). Per fluorocarbons (PFCs), hydro fluorocarbons (HFCs) and sulphur hexafluoride (SF6) emissions have been omitted as they are not a material source of greenhouse gases for WPP.
3. Organisational boundary
Emissions data is included for all operations for which WPP and its
subsidiaries have operational control. This covers 134,000 people.
Associate companies are excluded.
4. Operational boundary
We include the following emissions in our reporting:
- Direct emissions (scope 1): Fuel used to heat WPP premises (combustion of natural gas and heating oil).
- Indirect emissions (scope 2): All purchased electricity, including electricity purchased at grid average carbon intensity, purchased heat and steam, and renewable electricity purchased under specific contractual instruments, such as green-tariff contracts with supplier partners and energy attribute certificates (e.g. renewable energy certificates in the US or guarantees of origin in the EU).
- Other indirect emissions (scope 3): Business air travel and an
estimate for other scope 3 emissions that we do not currently
measure on a global basis, including emissions from leased cars,
taxis and couriers. This estimate is an additional 15% that we add
to our carbon footprint and is shown under ‘other estimated
scope 3 emissions’
5. Geographic scope
Our CO2e emissions data covers our worldwide operations.
6. Emission factors
CO2e emissions have been calculated on the basis of measured or
estimated energy use, fuel use and miles travelled, multiplied by the
relevant carbon emission factors. Our data is based on the following
emissions factors:
Emission factors
| Emission scope |
Emission factors used |
Scope 1
(fuel used to heat WPP premises) |
IPCC 2006 Guidelines for National Greenhouse Gas Inventories (using global warming potentials from the 2007 IPCC Fourth Assessment Report). |
Scope 2
(purchased electricity) |
– For the US: US Environmental Protection Agency eGRID 2016 (released in February 2018)
– For the UK: UK Department for Environment, Food & Rural Affairs (Defra), GHG Conversion Factors for Company Reporting (2017)
– For all other countries: International Energy Agency, CO2 Emissions from Fuel Combustion, 2017 Edition
|
Scope 3
(business air travel) |
UK Department for Environment,
Food & Rural Affairs (Defra), GHG
Conversion Factors for Company
Reporting (2017). |
We follow the market-based method of the revised version of the GHG Protocol Scope 2 Guidance. For full transparency, we also disclose total electricity purchased at grid average carbon intensity according to the location-based method of the Guidance mentioned above.
7. Data collection methodology
Data used to calculate CO2e emissions is collected quarterly through WPP’s financial reporting system, and includes some estimated data (e.g. in some locations electricity usage is estimated based on headcount or floor space). In 2017, our data covered 99% of our operations by headcount. The remaining 1% was extrapolated based on the Group’s total headcount at year-end.
8. External assurance
Our carbon data is reviewed by Bureau Veritas, an independent assurance provider. See its Independent Verification Statement on our website wpp.com/sustainability.