This section of the Compensation Committee Report sets out details of how the Company’s Compensation Policy was implemented in 2016. We start by setting out the details of the Compensation Committee – those setting and implementing the policy. We then present a summary of the 2016 executive compensation together with a summary of pay across the Group.
Governance in relation to compensation
Compensation Committee members
|
|
Attendance at 5 meetings in 2016 |
| Sir John Hood (Chairman) |
5 |
| Jacques Aigrain |
5 |
| Roberto Quarta |
5 |
| Tim Shriver |
5 |
During 2016, the Compensation Committee met five times on a formal basis, with additional informal meetings held as needed.
The committee members do not have any personal financial interest (other than as a share owner as disclosed in the Non-executive directors' interest section) in the matters to be decided by the committee, potential conflicts of interest arising from cross-directorships or day-to-day involvement in running the Group’s businesses. The terms of reference for the Compensation Committee are available on the Company’s website, and will be on display at the AGM, as set out in the Notice of AGM.
Advisors to the Compensation Commitee
The Compensation Committee regularly consults with Group executives. In particular, the committee invites certain individuals to attend meetings, including the Group chief executive (who is not present when matters relating to his own compensation or contracts are discussed and decided), the Company Secretary, the chief talent officer and the worldwide compensation & benefits director.
The latter two individuals provide a perspective on information reviewed by the committee and are a conduit for requests for information and analysis from the Company’s external advisors.
External advisors
The committee retains Willis Towers Watson to act as independent advisors. Willis Towers Watson is engaged to provide advice to the Compensation Committee and to work with management on matters related to our compensation policy and practices. Willis Towers Watson is a member of the Remuneration Consultants Group and has signed the code of conduct relating to the provision of advice in the UK. In light of this, and the level and nature of the service received, the committee remains satisfied that the advice is objective and independent.
Willis Towers Watson provides limited other services at a Group level, however some of the operating companies may engage advisors, including Willis Towers Watson, at a local level.
In 2016, Willis Towers Watson received fees of £220,968 in relation to the provision of advice to the committee. The committee receives external legal advice, where required, to assist it in carrying out its duties.
Statement of share owner voting
In 2016, a significant number of share owners voted against the Implementation Report of the Compensation Committee. The committee understands that the majority of share owners voting against the Implementation Report did so because of the level of the 2015 single figure of the Executive Directors, which was driven largely by the maturity of a legacy five-year long-term incentive plan award under LEAP. The 2011 LEAP award vested in full, reflecting very strong relative TSR performance and an almost doubling of the Company share price over the five-year investment and performance period. The committee is content that LEAP has performed as intended and in the manner approved by share owners when the plan was implemented and when the last compensation policy was approved.
The committee would also like to remind share owners that the LEAP program was replaced in 2013 with a new long-term incentive plan, but that the first five-year awards under this plan will not vest until 2018.
| Resolution |
Votes for |
|
Votes against |
|
Votes cast |
Votes withheld |
| Number |
% |
Number |
% |
Number |
Number |
| To approve the Implementation report of the Compensation Committee |
649,465,421 |
66.55 |
326,385,527 |
33.45 |
975,850,948 |
11,128,256 |
Executive Directors’ total compensation received (audited)
Single total figure of compensation
|
|
|
Base salary |
Benefits3 |
DEPs4 |
Pension |
Short-term
incentives5 |
Long-term
incentives6 |
Total annual compensation |
|
|
|
£000 |
£000 |
£000 |
£000 |
£000 |
£000 |
£000 |
| Sir Martin Sorrell1 |
2016 |
1,150 |
228 |
1,758 |
460 |
2,992 |
41,560 |
48,148 |
|
|
2015 |
1,150 |
193 |
1,545 |
460 |
4,278
|
62,783 |
70,409 |
| Paul Richardson1,2 |
2016 |
798 |
62 |
– |
240 |
1,517 |
6,698 |
9,315 |
|
|
2015 |
718 |
67 |
– |
216 |
1,648 |
8,859 |
11,508 |
Fixed elements of compensation (audited)
Base salary
|
|
Effective date |
Contractual salary
000 |
Base salary received in 2016
000 |
| Sir Martin Sorrell |
1 January 2013 |
£1,150 |
£1,150 |
| Paul Richardson |
1 July 2013 |
$945 and £100 |
$1,0801 |
Each Executive Director receives a fee of £100,000 for their directorship of WPP plc, included in the base salary figure above. The base salary for the Executive Directors is reviewed, but not necessarily changed, every 24 months. There have been no changes in base salary for the Executive Directors since 2013.
Benefits, dividend equivalent payments and pension
|
|
2016 Benefits
£000 |
2016 DEPs
£000
|
| Sir Martin Sorrell1 |
228 |
1,758 |
| Paul Richardson1 |
62 |
– |
The benefits shown are those provided to the Executive Directors that are deemed taxable in the UK, or those that would be taxable if Paul Richardson were resident in the UK. The value of benefits received that are detailed in the numbers above include car and/or car allowance, healthcare, life assurance, long-term disability allowance and a per diem housing allowance paid when the executive uses their own accommodation when travelling outside of their home country. The benefits set out exclude the disclosable value of expenses related directly to attendance at Board meetings that would be chargeable to UK income tax.
The table above also includes share owner-approved dividend equivalent payments of £1,757,739 (£1,545,340 during 2015) which are due on certain of Sir Martin Sorrell’s deferred share awards. The following table provides a breakdown of the key taxable benefits for 2016:
|
|
Car benefits
£000 |
Healthcare
£000 |
Accommodation allowance
£000 |
Other expenses
£000 |
| Sir Martin Sorrell1 |
37 |
68 |
86 |
37 |
| Paul Richardson1 |
27 |
15 |
19 |
1 |
Contractual pension
(% of base salary) |
2016 Pension
£000 |
| Sir Martin Sorrell |
40% |
460 |
| Paul Richardson |
30% |
240 |
All pension benefits for the Executive Directors are provided on either a defined contribution or a cash allowance basis. Only base salary is pensionable. No changes have been made to pension contribution rates in the last year, but Sir Martin Sorrell’s contractual pension as a percentage of base salary will reduce to 30% in July 2017 subject to policy approval at the upcoming AGM.
Variable elements of pay (audited)
Short-term incentive
This section summarises the Compensation Committee’s assessment of the Executive Directors’ performance during 2016 under the short-term incentive plan.
2016 short-term incentive plan outcome (percentages expressed relative to base salary)
|
|
Actual short-term incentive received |
Attributed to financial objectives |
Attributed to personal objectives |
Total 2016 short-term incentives £000 |
| Sir Martin Sorrell |
260% |
160% |
100% |
2,992 |
| Paul Richardson |
190% |
140% |
50% |
1,517 |
In respect of the 2016 short-term incentive awards, half will be delivered in the form of shares as an Executive Share Award (ESA) with a two-year deferral requirement. ESAs are subject to malus provisions. The cash bonuses are subject to clawback provisions.
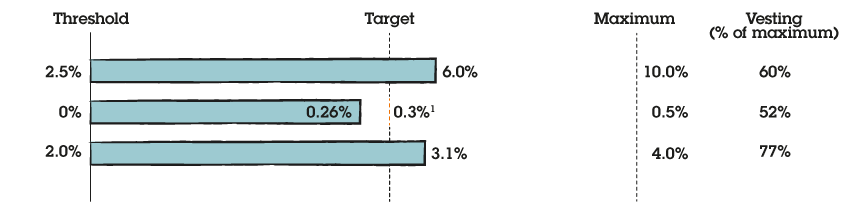
Performance against financial objectives (70% of the award)
Performance against all financial objectives is calculated on a pro forma ('like-for-like') basis other than net sales margin that is calculated on a constant currency basis. The key financial short-term incentive plan objectives for all the Executive Directors are consistent with 2015 and provide a robust basis for assessing financial achievement.
2016 was another record year with the Company producing strong net sales and profit growth whilst margins performance was robust. The achievements against our stretching targets are illustrated below and demonstrates out-performance against the profit and net sales targets and a slight under-performance against the very ambitious margin improvement target.
Group performance (CEO and CFO)
2016 financial objectives (70% of the award)
- Like-for-like headline PBT growth (⅓)
- Constant currency headline net sales margin improvement (⅓)
- Like-for-like growth in net sales (⅓)
Performance against individual strategic objectives (30% of the award)
| Executive Director |
Personal measure 2016 |
Clarification of measures |
Maximum potential (% of base salary) |
Award received (% of maximum) |
| Sir Martin Sorrell |
Leadership planning |
Actively managing the process of strengthening the Group’s senior leadership teams through internal development, promotions, transfers and external hires. |
131% |
77% |
| Strategic planning & execution |
Key focus areas include maintaining creative excellence; driving strategy in the digital, data, analytics and new markets; improving the effectiveness of the WPP horizontality approach to enhance client service delivery. |
| Paul Richardson |
Working capital management |
Improving year-on-year rolling average net working capital as a percentage of the annual revenue trend. |
90% |
55% |
| WPP IT transformation |
Implementing a transformational program of outsourcing IT services to produce enhanced service and cost savings in future years. |
| Financial control |
Demonstrating measures taken to improve operating company balance sheet control and management. |
2016 short-term incentive plan awards
Based on the performance set out above, the short-term incentive award for each executive was:
|
|
Base salary 000 |
Target bonus % of base salary |
Maximum bonus % of base salary |
2016 award % against target/maximum |
Total 2016 short-term incentive award
000 |
| Sir Martin Sorrell |
£1,150 |
217.5% |
435% |
120%/60% |
£2,992 |
| Paul Richardson |
$1,0801 |
200% |
300% |
95%/63% |
$2,056 |
As noted above, 50% of the 2016 bonus is delivered in the form of WPP shares as an Executive Share Award (ESA). These shares are granted post determination of the annual bonus achievement and will vest, subject to continued employment, two years later.
Short-term incentive weightings and measures for 2017
The committee has reviewed the performance objectives and weightings for 2017 to ensure continued alignment with Company strategy. The weighting of financial objectives (70%) and individual strategic objectives (30%) will remain unchanged as will the Group financial measures of headline PBT growth, net sales margin improvement and net sales growth.
The committee is of the view that the targets for the STIP are commercially sensitive and it would be detrimental to the Company to disclose them in advance of or during the relevant performance period. To the extent targets are no longer commercially sensitive they will be disclosed at the end of the relevant performance period in that year’s Annual Report.
Long-term incentives (audited)
2012 – 2016 LEAP III awards vesting
The 2012 awards were the final awards granted under LEAP III, the long-term incentive plan which in 2013 was replaced by the EPSP. Vesting of LEAP awards was solely dependent on WPP’s relative TSR performance measured in common currency, against a custom group of WPP’s comparators (Aegis, Arbitron, Dentsu, GfK, Havas, Interpublic, Ipsos, Omnicom, Nielsen and Publicis), weighted by their respective market capitalisation.
Over the five-year investment and performance period, WPP out-performed 95% of the weighted peer group including both Omnicom and Publicis, WPP’s largest and most comparable multi-line competitors. Over the period, WPP delivered TSR of 210% which means that a shareholding of £100 at the start of the period would be worth £310 at the end, including reinvested dividends. The underlying financial and operational performance was also strong over the five-year period, consistent with the TSR outcome.
Aegis and Arbitron, two of the comparator companies, were taken over during the investment and performance period by Dentsu and Nielsen, respectively. In line with the guidelines previously established by the committee, the two companies were removed from the comparator group as neither company was listed for more than 40% of the investment and performance period.
WPP’s TSR performance relative to the comparator group resulted in a match of 500%, equating to the maximum award.
|
Number of shares vesting |
Share price
on vesting
|
Value of match at grant price of £8.5975/$69.2492
000 |
Value added due to dividends
000 |
Value added due to share price appreciation
000 |
2016 Long term incentives
000 |
| Sir Martin Sorrell |
2,406,380 |
£17.2708 |
£18,529 |
£4,339 |
£18,692 |
£41,560 |
| Paul Richardson1 |
86,690 |
$104.6617
|
$5,373 |
$953 |
$2,747 |
$9,073 |
Sir Martin Sorrell

Paul Richardson

2016 EPSP awards granted
In 2016, the Executive Directors, along with a select number of senior executives within the Group, were granted awards under the Executive Performance Share Plan (EPSP). The 2016 awards are subject to three equally-weighted independent performance conditions, being relative TSR, EPS and ROE. Performance is measured over the five financial years starting in 2016 as follows:
| Measure |
Total Shareholder Return (TSR) |
Earnings Per Share (EPS) |
Return On Equity (ROE) |
| Weight |
One-third |
One-third |
One-third |
| Nature |
Relative to peers |
WPP growth |
WPP absolute |
| Performance zone (threshold to maximum) |
Median to upper decile |
7% – 14% compound annual growth |
15% – 18% annual average1 |
| Payout |
Below threshold: 0% of element vests
Threshold: 20%2 of element vests
Maximum of above: 100% of element vests
Straight-line vesting between threshold and maximum |
| Performance period |
Five-years ending on 31 December 2020 |
As in previous years, WPP’s TSR performance is compared to companies representing our most relevant, listed global competitors, weighted by market capitalisation. In 2016, the comparator group comprised Dentsu, GfK, Havas, Interpublic, Ipsos, Nielsen, Omnicom and Publicis. TSR performance is calculated on a market capitalisation-weighted basis in both common and local currency (weighted equally). Using a dual basis ensures that the interests of both local and international investors are reflected in the performance measures.
The following interests were awarded on 28 November 2016 at the preceding five-day average share price of £17.052 (ordinary shares) or $105.93092 (ADRs).
|
Basis and level of award
(% of salary) |
Award over |
Number of interests awarded |
Face value at date of grant
000 |
| Sir Martin Sorrell |
974%1 |
Ordinary Shares |
656,873 |
£11,201 |
| Paul Richardson |
400%1 |
ADRs |
41,536 |
$4,400 |
EPSP measures and targets for 2017 - 2021
The committee have reviewed both the measures and the targets as part of the review of the Directors’ Compensation Policy that is being submitted to share owners for approval. The committee judge that the balance of measures remains appropriate and aligned to the Company’s business objectives and that the targets remain challenging and in line with financial forecasts.
As set out in the Directors’ Compensation Policy, the committee’s objective is to align variable compensation with the key strategic priorities of WPP, maximising the dynamic between pay and performance.
This dynamic is contingent upon the committee setting challenging targets each year. The following graph and table demonstrate the relationship between pay and performance over the last eight years for the Group chief executive.
Historical TSR performance1 Value of hypothetical £100 holding
| Financial year 31st December |
2009 |
2010 |
2011 |
2012 |
2013 |
2014 |
2015 |
2016 |
|
| CEO total compensation (£000)2 |
7,199 |
11,597 |
11,941 |
17,543 |
29,846 |
42,704 |
70,4095 |
48,148 |
|
| Year-on-year change in CEO total compensation |
63% |
61% |
3% |
47% |
70% |
43% |
65% |
-32% |
|
| Short-term incentive award against maximum |
32% |
95% |
77% |
62% |
82% |
72% |
86% |
60% |
|
| Long-term incentive award against maximum |
50% |
83% |
46% |
86% |
87% |
100% |
100% |
100% |
|
| Change in annual TSR3 |
66% |
32% |
-13% |
38% |
56% |
3% |
18% |
19% |
|
| Change in five-year TSR4 |
10% |
37% |
13% |
45% |
241% |
172% |
135% |
210% |
|
Relative importance of spend on pay
The following table sets out the percentage change in total staff costs, headcount, dividends and share buy-backs.
|
|
2016 |
2015 |
% change |
| Total staff costs |
£7,784.9m |
£6,652.6m |
17.02% |
| Headcount – average over the year |
132,657 |
124,930 |
6.19% |
| Dividends and share buy-backs |
£1,043.9m |
£1,133.4m |
-7.90% |
Relative change in pay for the Group chief executive
The following table summarises the change in the Group chief executive’s base salary, taxable benefits and annual bonus, compared to that of full-time employees within the Group. The higher level of taxable benefits of the chief executive officer is due to the increased cost of insured benefits. The cost of UK taxable benefits have reduced due to more effective and efficient management of benefit provision. The benefits received by employees has remained constant.
|
|
Base salary1 |
Taxable benefits1,2 |
Annual Bonus1 |
| Group chief executive |
No change |
18.1% |
-30.1% |
| All employees |
1.5% |
-6.6% |
-11.7% |
Non-executive directors’ fees
The fees due to non-executive directors, last reviewed on 1 July 2013, are set out below (£000).
| Chairman |
475 |
| Non-executive director |
70 |
| Senior independent director |
20 |
| Chairmanship of Audit or Compensation Committee |
40 |
| Chairmanship of Nomination and Governance Committee |
15 |
| Member of Audit or Compensation Committee |
20 |
| Member of Nomination and Governance Committee |
10 |
Non-executive directors’ total compensation received (audited)
The single total figure of compensation table below details fee payments received by the non-executive directors while they held a position on the Board. During both 2015 and 2016, the Company met the cost (including national insurance and income tax, where relevant) of expenses incurred by the non-executive directors in performing their duties of office, in accordance with the policy set out in Directors’ Compensation Policy table – chairman and non-executive directors.
In 2016, the disclosable value of the expenses that would be chargeable to UK income tax totalled £98,407 (including £32,314 of national insurance and income tax, where relevant).
|
|
|
Fees
£000 |
| 2016 |
2015 |
| Roberto Quarta1 |
475 |
305 |
| Roger Agnelli2 |
23 |
114 |
| Jacques Aigrain |
130 |
121 |
| Charlene Begley |
100 |
100 |
| Tarek Farahat3 |
13 |
– |
| Sir John Hood |
110 |
110 |
| Ruigang Li |
80 |
96 |
| Daniela Riccardi |
80 |
88 |
| Nicole Seligman |
85 |
86 |
| Hugo Shong |
80 |
112 |
| Timothy Shriver |
90 |
106 |
| Sally Susman |
80 |
80 |
| Sol Trujillo |
90 |
106 |
Past directors
During 2016, payments were made to past directors who continued to provide advisory services to the Company. A payment of £59,054 was made to John Quelch in respect of educational presentations he gave to companies within the WPP Group. A payment of £30,000 was made to John Jackson in respect of his advisory role to WPP, which enables the Company to benefit from his considerable knowledge and experience in the communications and marketing services sector.
Executive Directors’ interests (audited)
Executive Directors’ interests in the Company’s ordinary share capital are shown in the following table. Other than as disclosed in this table, and in the Compensation Committee report, no Executive Director had any interest in any contract of significance with the Group during the year. Each Executive Director has a technical interest as an employee and potential beneficiary in shares in the Company held under the ESOPs. More specifically, the Executive Directors have potential interests in shares related to the outstanding awards under the LEAP program and the EPSP in addition to outstanding ESAs. As at 31 December 2016, the Company’s ESOPs (which are entirely independent of the Company and have waived their rights to receive dividends) held in total 13,857,706 shares in the Company (17,154,359 in 2015).
| |
|
|
|
Outstanding scheme interests
|
|
Director
|
|
Total share
interests
(including
charitable
foundation) |
Total beneficial interests and deferred
awards1
|
Deferred awards
(without
performance
conditions vested
but
unexercised,
included in
Total beneficial)2
|
Shares without
performance
conditions
(unvested)3,4
|
Shares with
performance
conditions
(unvested)5,6
|
Total
unvested
shares
|
|
Sir Martin Sorrell7
|
At 31 Dec 2016 |
24,547,301 |
21,021,365 |
8,773,456 |
247,164 |
5,450,606 |
5,697,770 |
| |
At 19 Apr 2017 |
25,859,089 |
21,283,153 |
8,773,456 |
133,817 |
3,295,436 |
3,429,253 |
|
Paul Richardson
|
At 31 Dec 2016 |
1,000,265 |
1,000,265 |
– |
103,270 |
1,250,220 |
1,353,490 |
| |
At 19 Apr 2017 |
1,068,240 |
1,068,240 |
– |
54,185 |
862,295 |
916,480 |
Share ownership guidelines
As detailed in the Directors’ Compensation Policy, the Executive Directors are required to achieve a minimum level of share ownership of WPP shares. The Group chief executive and Group chief financial officer are required to hold shares to the value of 600% and 300% of base salary respectively.
At the end of 2016, and at the date of this Compensation Committee report, both Executive Directors exceeded their respective share ownership guidelines by a substantial margin.
Non-executive Directors’ interests (audited)
Non-executive directors’ interests in the Company’s ordinary share capital are shown in the following table. Except as disclosed in this table, and in the Compensation Committee report, no non-executive director had any interest in any contract of significance with the Group during the year.
| Non-executive director |
Total interests at 31 December 2016 |
Total interests at 19 April 2017 |
| Roberto Quarta |
27,500 |
27,500 |
| Jacques Aigrain |
9,000 |
9,000 |
| Charlene Begley |
2,140 |
2,140 |
| Tarek Farahat1 |
– |
- |
| Sir John Hood |
3,000 |
3,000 |
| Ruigang Li |
4,000 |
4,000 |
| Daniela Riccardi |
– |
4,100 |
| Nicole Seligman |
6,250 |
6,250 |
| Hugo Shong |
– |
22,915 |
| Timothy Shriver |
10,070 |
10,070 |
| Sally Susman |
5,000 |
5,000 |
| Sol Trujillo |
10,000 |
10,000 |
Outstanding share-based awards
Executive Share Awards (ESAs) held by Executive Directors
All Executive Share Awards granted under the Restricted Stock Plan are made on the basis of satisfaction of previous performance conditions and are subject to continuous employment until the vesting date. The table does not include the 2016 ESAs as these will not be granted until after publication of this Annual Report. Unless otherwise noted, awards are made in the form of WPP ordinary shares.
|
|
|
Grant
date |
Share/ADR price on grant date |
No. of Shares/ADRs
granted2 |
Face value on grant
date3
000 |
Additional shares granted in lieu of dividends |
Total shares vesting |
Vesting date |
Shares / ADR price on vesting |
Value on vesting 000 |
| Sir Martin Sorrell |
2013 ESA |
27.05.14 |
£12.8850 |
159,691 |
£2,058 |
9,311 |
169,002 |
06.03.16 |
£15.4962 |
£2,619 |
|
|
2014 ESA |
27.05.15 |
£15.8350 |
113,347 |
£1,795 |
– |
– |
06.03.17 |
– |
– |
|
|
2015 ESA |
07.06.16 |
£15.9850 |
133,817 |
£2,139 |
– |
– |
06.03.18 |
– |
– |
| Paul Richardson1 |
2013 ESA |
27.05.14 |
$108.1000 |
12,970 |
$1,402 |
747 |
13,717 |
06.03.16 |
$110.2500 |
$1,512 |
|
|
2014 ESA |
27.05.15 |
$121.7200 |
9,817 |
$1,195 |
– |
– |
06.03.17 |
– |
– |
|
|
2015 ESA |
07.06.16 |
$116.2700 |
10,837 |
$1,260 |
– |
– |
06.03.18 |
– |
– |
Long-term incentive plans – Leadership Equity Acquisition Plans
The following table summarises the awards outstanding under LEAP III. The last award under this plan vested on 7 March 2017, details can be found in Long-term incentives (audited)
| Name |
Award date |
Investment and performance period |
Number of investment shares/ADRs |
Share/ADR price on grant date |
Maximum number of matching units at
1 Jan 20162 |
During 2016 |
Maximum number of matching units at 31 Dec 2016 |
Share/ADR price on vesting |
Value on vest/deferral date
000 |
Granted/
(Lapsed) units |
Additional dividend shares |
Vested or deferred shares |
| Sir Martin Sorrell |
|
|
07.12.11 |
01.01.11 – 31.12.15 |
711,159 |
£6.6475 |
3,555,795 |
(0) |
426,810 |
3,982,605 |
– |
£15.7644 |
£62,783 |
|
|
10.12.12 |
01.01.12 – 31.12.16 |
431,034 |
£8.5975 |
2,155,170 |
– |
– |
– |
2,155,170 |
– |
– |
| Paul Richardson |
|
|
07.12.11 |
01.01.11 – 31.12.15 |
100,344 |
£6.6475 |
501,720 |
(0) |
60,220 |
561,940 |
501,720 |
£15.7644 |
£8,859 |
| |
10.12.121 |
01.01.12 – 31.12.16 |
15,517 |
$69.2500 |
77,585 |
– |
– |
– |
77,585 |
– |
– |
Long-term incentive plans – Executive Performance Share Plan
The following table summarises all of the awards outstanding under the Executive Performance Share Plan.
| During 2016 |
|
|
Grant date |
Performance period |
Maximum number of nil cost options over shares/ADRs
awarded2 |
Share/ADR price on grant date |
Nil cost options vested/(lapsed) |
Additional dividend shares |
Nil cost options exercised or deferred |
Maximum number of nil cost options over shares/ADRs at 31 Dec 2016 |
| Sir Martin Sorrell |
28.06.13 |
01.01.13-31.12.17 |
1,032,540 |
£10.8480 |
– |
– |
– |
1,032,540 |
|
|
04.06.14 |
01.01.14-31.12.18 |
867,756 |
£12.9080 |
– |
– |
– |
867,756 |
|
|
09.06.15 |
01.01.15-31.12.19 |
738,267 |
£15.1720 |
– |
– |
– |
738,267 |
|
|
28.11.16 |
01.01.16-31.12.20 |
656,873 |
£17.0520 |
– |
– |
– |
656,873 |
| Paul Richardson1 |
28.06.13 |
01.01.13-31.12.17 |
52,026 |
$83.4186 |
– |
– |
– |
52,026 |
|
|
04.06.14 |
01.01.14-31.12.18 |
40,927 |
$107.9960 |
– |
– |
– |
40,927 |
|
|
09.06.15 |
01.01.15-31.12.19 |
37,970 |
$115.8800 |
– |
– |
– |
37,970 |
|
|
28.11.16 |
01.01.16-31.12.20 |
41,536 |
$105.9309 |
– |
– |
– |
41,536 |
Full details of the 2016 EPSP award, including performance measures and targets, can be found in EPSP measures and targets for 2017 – 2021.