Dear share owner
Y
our Company celebrated its thirtieth birthday in 2015 with another record year: revenue, profitability, net sales margins and earnings per share all reached new highs, despite strong currency headwinds in the second half and a generally low-growth global environment. For the fifth successive year, WPP was named Creative Holding Company of the Year at the Cannes International Festival of Creativity, in recognition of your Company’s collective creative excellence; and also for the fourth consecutive year, WPP was ranked Most Effective Holding Company in the Effie Global Effectiveness Index; and, for the second year in a row, Warc’s Most Effective Holding Company.

Cannes International Festival of Creativity
Holding Company of the Year
2011, 2012, 2013, 2014, 2015

Effie Global Effectiveness Index
Most Effective Holding Company of the Year
2012, 2013, 2014, 2015
At the same time, we have responded to the changing competitive landscape by accelerating the implementation of our strategic goals. Sector targets for faster-growth markets and new media have been raised to 40-45% of revenue over the next five years and horizontality across clients, countries and regions has been raised to our number one strategic priority.
Your share price increased by over 16% in 2015, closing at 1,563.0p at year end. Since then it has strengthened
further to 1,656.0p, up a further 6%, at the time of writing, reflecting our record results for 2015, as well as slightly stronger global stock markets in recent weeks. Dividends increased by 17% to 44.69p, a new high. This represents a dividend pay-out ratio of 47.7% of headline diluted earnings per share, compared with 45.0% in 2014. It now seems possible that the newly targeted pay-out ratio of 50% will be achieved by the end of 2016, one year ahead of target.
Reported billings were £47.6 billion, up almost 5% in constant currencies, driven by a strong overall leadership position in net new business league tables for the fourth year in a row and GroupM topping both the RECMA media tsunami net new business and retention tables. Revenue was up over 6% to £12.2 billion and up well over 7% in constant currencies. Net sales were up well over 4% and almost 6% in constant currencies. Including 100% of associates and investments, revenue is estimated to total around £17 billion (over $27 billion). Headline PBIT was up well over 5% to £1.774 billion and up well over 8% in constant currencies. Net sales margins increased by 0.2 margin points to an industry-leading 16.9% and, on a constant currency basis, were up 0.4 margin points, ahead of the targeted constant currency increase of 0.3 margin points.
Reported profit before interest and tax rose 7% to £1.679 billion from £1.569 billion, up well over 10% in constant currencies. Headline EBITDA increased by almost 5% to £2.002 billion, crossing £2 billion for the first time, up well over 7% in constant currencies. Headline profit before tax was up over 7% to £1.622 billion and reported profit before tax was up almost 3% to £1.493 billion. Diluted headline earnings per share rose by over 10% to 93.6p (an all-time high) and diluted reported earnings per share were up almost 10% to 88.4p, both reflecting strong like-for-like revenue and net sales growth, margin improvement and the benefit of acquisitions.
Return on equity increased 1.3 percentage points to 16.3% in 2015 compared with 15.0% in 2014, while the weighted average cost of capital increased to 6.7% in 2015 from 6.1% in 2014. Additionally, the value of the Group’s non-controlled investments rose by almost £500 million to £1.2 billion during the year, chiefly reflecting the increasing value of our content businesses, primarily VICE, and the partnership formed during the year with comScore.
Free cash flow amounted to almost £1.3 billion in 2015, over £1 billion for the fifth consecutive year. Average net debt was £3.6 billion in 2015, compared to £3.1 billion in 2014, at 2015 exchange rates, and net debt at 31 December 2015 was £3.2 billion, against £2.3 billion in 2014, reflecting significant incremental net acquisition spend of £0.2 billion, incremental share re-purchases of £0.1 billion, and incremental dividends of £0.1 billion. The average net debt to headline EBITDA ratio in 2015 was 1.8 times, which is in the middle of the Group’s target range of 1.5-2.0 times.
Headline interest cover in 2015 was 11.7 times. So far, in the first two months of 2016, average net debt is up at £3.5 billion against £2.7 billion for the same period in 2015, at 2016 exchange rates, reflecting the same factors as the full-year average for 2015. Our long-term debt is currently rated Baa2 and BBB and our short-term debt P2 and A2, by Moody’s and Standard & Poor’s respectively.
With the equity market capitalisation at the time of writing of approximately £21.4 billion, the total enterprise value of your Company is approximately £25.5 billion, a multiple of 12.8 times 2015 headline EBITDA.
Revenue growth impacted by strong currency headwinds
Our reported revenue growth for the year was 6.1%, and on a constant currency basis, which excludes the impact of currency movements, revenue was up 7.5%. This difference of 1.4% reflects strong foreign currency headwinds in the second half: chiefly due to the strength of the pound sterling, primarily against the euro, partly offset by the weakness of the pound sterling against the US dollar.
On a like-for-like basis, which excludes the impact of currency and acquisitions, revenue was up 5.3%, with net sales up 3.3%. In the fourth quarter, like-for-like revenue was up well over 6%, the strongest quarter of the year, following like-for-like growth in the third quarter of well over 4%, due to stronger growth in the fourth quarter in North America, the UK and Asia Pacific, Latin America, Africa & the Middle East and Central & Eastern Europe, partly offset by slightly slower growth in Western Continental Europe. Like-for-like net sales were up almost 5% in the fourth quarter, the strongest quarter of the year, with all regions, except the UK and Western Continental Europe, recording their strongest quarter of the year.
Our 5 ‘Billion Dollar Markets’
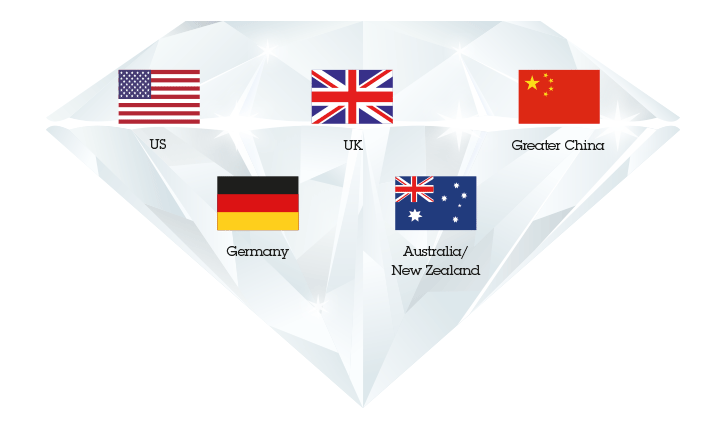
WPP companies (including associates and investments) generated revenues of more than $1 billion in five markets
Constant currency1 revenue growth %

Constant currency1 net sales growth by geography %

Net sales margin2 by geography %

Revenue by geography £m
- North America
- UK
- Western Continental Europe
- Asia Pacific, Latin America, Africa & Middle East and Central & Eastern Europe
North America leads the way
North America, with constant currency revenue growth of over 11% in the final quarter and like-for-like growth of well over 9%, strengthened further, exceeding the strong growth seen in the first nine months, an improvement over the third quarter year-to-date constant currency growth of well over 6% and like-for-like growth of over 6%. Particularly strong growth was achieved in Advertising and Media Investment Management, parts of the Group’s Public Relations & Public Affairs businesses and Branding & Identity, direct, digital and interactive operations. On a full-year basis, constant currency revenue was up almost 8%, with like-for-like up over 7%. Net sales were up well over 4% in constant currency, with like-for-like up over 4%.
The UK rate of growth in the final quarter, although lower than quarter three, remained strong at well over 6% in constant currency, compared to well over 7% in quarter three, with like-for-like growth of almost 3%, well ahead of the 1% seen in quarter three. The Group’s Advertising, Public Relations & Public Affairs, Branding & Identity and direct, digital and interactive businesses performed particularly well. Despite the slight slow-down in the rate of revenue growth, net sales remained strong, with constant currency growth of almost 7%, slightly down on quarter three, with like-for-like growth of 3.5% compared with over 2% in quarter three. On a full-year basis, constant currency revenue was up over 8%, with like-for-like up over 4%. Net sales were up almost 8% in constant currency, with like-for-like up almost 3%.
2015 revenue by geography versus peers $bn
- Rest of World5
- Western Europe (including UK)
- North America
Western Continental Europe, although remaining patchy from a macroeconomic point of view, continued the improvement seen in quarter three, with constant currency revenue growth of well over 6%, the highest rate of quarterly growth in 2015, and partly driven by acquisitions. Like-for-like revenue was up over 5% in the final quarter, down slightly on the 6% seen in quarter three. Similarly, net sales growth on a constant currency basis was up over 7% in the final quarter, the highest rate of quarterly growth in 2015, compared to over 4% in quarter three, again partly driven by acquisitions. On a like-for-like basis, net sales were up 3% in the final quarter, compared with well over 4% in quarter three. For the year, Western Continental Europe revenue grew by well over 4% like-for-like (well over 5% in the second half), compared with almost 4% in 2014, with net sales growth of 2.5% like-for-like (well over 3% in the second half), compared to over 1% in 2014. Belgium, Denmark, Germany, Italy and Turkey all showed good growth in the final quarter, but Austria, France, Ireland, the Netherlands, Spain, Sweden and Switzerland were tougher.
In Asia Pacific, Latin America, Africa & Middle East and Central & Eastern Europe, on a constant currency basis, revenue growth in the fourth quarter remained strong at over 9%, ahead of the first nine months growth of over 8%. Like-for-like revenue growth in the final quarter was over 6%, the second highest quarter of 2015, slightly lower than the almost 7% seen in quarter one. Growth in the fourth quarter was driven principally by Asia Pacific, Latin America and Africa, the CIVETS1, Next 112 and the MIST3. Central & Eastern Europe, after the improvement seen in quarter three, slipped back slightly, with full-year like-for-like revenue down over 1%. Constant currency net sales growth in the region as a whole was over 7%, with like-for-like net sales up 3%. In Asia, Bangladesh, Cambodia, India, Indonesia, Myanmar, Pakistan and Vietnam, had double-digit like-for-like growth, while Japan and Malaysia were more challenging.
Quarter four in Latin America was the strongest of the year, with like-for-like revenue up almost 8%, compared with quarter three, the next highest, with over 4%. Like-for-like net sales grew over 7% in quarter four, also the highest quarterly growth in 2015, with full-year growth of almost 5% (over 6% in the second half compared with well over 2% in the first half).
Africa also grew strongly, with like-for-like revenue up over 8% in both quarter four and the full year, driven by the Group’s Media Investment Management, Data Investment Management and direct, digital and interactive businesses. In Central & Eastern Europe, like-for-like revenue was up over 1% in quarter four, compared with 3% in quarter three, with Croatia, the Czech Republic, Hungary and Kazakhstan up strongly. Poland, Russia and the Slovak Republic were tougher.
Full-year revenue for the BRICs4, which account for over $2.8 billion of revenue, was up well over 3% on a like-for-like basis, with the Next 11 and the CIVETS up over 9% and well over 11% respectively. The MIST was up almost 8%. In 2015, 29% of the Group’s revenue came from Asia Pacific, Latin America, Africa & Middle East and Central & Eastern Europe – down slightly from almost 30% in 2014, due to the strength of sterling against the currencies of many of the markets in these regions still having a significant impact. On a net sales basis, there was also a slight drop to almost 30%, which compares with the Group’s strategic objective of 40-45% in the next five years. Markets outside North America now account for 63% of our revenue.
Constant currency1 revenue growth by sector %

Constant currency1 net sales growth by sector %

Net sales margin2 by sector %

Revenue by sector £m
- Advertising and Media Investment Management
- Data Investment Management
- Public Relations & Public Affairs
- Branding & Identity, Healthcare and Specialist Communications
Advertising and Media Investment Management was the strongest performing sector, with constant currency revenue growth of almost 10% for the year, and 9% in quarter four. Like-for-like revenue was up over 8% for both the year and quarter four. Advertising grew strongly in North America and Latin America in quarter four, but the UK, Continental Europe and Africa were more difficult and, overall, Advertising remained challenged. Media Investment Management showed strong like-for-like growth, with double-digit growth in all regions and sub-regions, except the UK and the Middle East.
Of the Group’s advertising networks, J. Walter Thompson Worldwide, Ogilvy & Mather and Grey performed well in quarter four. Growth in the Group’s Media Investment Management businesses has been very consistent throughout the year, with constant currency and like-for-like revenue up strongly for the year, but with a slightly weaker second half, principally in the UK. tenthavenue, the ‘engagement’ network focused on out-of-home media, also performed strongly in the fourth quarter, with like-for-like net sales growth up almost 9%. The strong revenue and net sales growth across most of the Group’s businesses, partly offset by the challenges in the Group’s Advertising businesses in most regions, resulted in the combined net sales margin of this sector dropping 0.2 margin points to 18.4%, but improving by 0.2 margin points in constant currency.
Our 9 ‘Billion Dollar Brands’
Nine WPP brands have
generated revenues of
$1 billion or more
In 2015, J. Walter Thompson Worldwide, Ogilvy & Mather, Y&R and Grey generated estimated net new business billings of almost £1.1 billion ($1.7 billion). GroupM (the Group’s Media Investment Management arm, which includes Mindshare, MEC, MediaCom, Maxus, GroupM Connect, Xaxis and now Essence), together with tenthavenue, generated estimated net new business billings of £3.8 billion ($6.0 billion). The Group’s net new billings totalled £5.6 billion ($8.6 billion), slightly down on the £5.8 billion ($9.3 billion) recorded in 2014.
Data Investment Management revenue grew by almost 6% in the fourth quarter on a constant currency basis, the strongest quarter of 2015, and 1.4% like-for-like. Net sales showed a similar pattern, up over 5% in constant currency in quarter four and almost 1% like-for-like. On a full-year basis, revenue was up 3.5% in constant currency, but down 0.2% like-for-like, with the second half stronger than the first half. Net sales showed a similar trend, with a stronger second half on both a constant currency and like-for-like basis. The mature markets were more difficult, remaining under pressure, but in the faster growth markets net sales were up almost 2%. Syndicated research continues to show resilience, with like-for-like net sales growth up well over 2%, but custom research, which accounts for almost half of Data Investment Management net sales, was down by a similar amount.
Kantar Worldpanel, Kantar Health, Kantar Retail and IMRB all showed strong like-for-like net sales growth, while TNS, Millward Brown and Lightspeed were more challenged. There seems to be a growing recognition of the value of ‘real’ first-party data businesses, rather than those that depend on third-party data. Net sales margins improved by 0.6 margin points to 16.2% and by 1.1 margin points in constant currency. Good cost control and the continued benefits of restructuring contributed to the improvement in net sales margins. Although there has been further improvement during 2015, the slowest sub-sector continues to be like-for-like net sales growth in the custom businesses in mature markets, where discretionary spending remains under review by clients.
The Group’s Public Relations & Public Affairs businesses continued the growth shown earlier in the year, with a stronger second half and even stronger quarter four. Constant currency revenue growth in quarter four was over 8%, and like-for-like net sales were up almost 6%, with strong growth in all regions, but particularly in the UK, Latin America and Africa & the Middle East. On a full-year basis, revenues were up well over 4% in constant currency and 3% like-for-like. Ogilvy Public Relations, Cohn & Wolfe and the specialist Public Relations & Public Affairs businesses in the US, the UK and Germany performed well, with Burson-Marsteller and Hill+Knowlton Strategies less buoyant. An improving top-line and good control of costs resulted in net sales margins for the year improving by 0.9 margin points to 16.7% and by 1.0 margin point in constant currency.
At the Group’s Branding & Identity, Healthcare and Specialist Communications businesses (including direct, digital and interactive), constant currency revenue grew strongly at over 11% in quarter four (as with most of our businesses, the strongest quarter of 2015) and like-for-like revenue was up almost 9%, a significant improvement over quarter three. Full-year revenue was up over 7% in constant currency and over 5% like-for-like. The Group’s direct, digital and interactive businesses, especially JWT Mirum (the digital arm of J. Walter Thompson Worldwide), WPP Digital and VML performed strongly, with parts of the Group’s Healthcare Communications and Branding & Identity businesses slower. Net sales margins for the sector as a whole improved 0.3 margin points to 15.0% and by 0.3 margin points in constant currency.
In 2015, 37.5% of the Group’s revenue came from direct, digital and interactive, up over one percentage point from the previous year, with revenue growing well over 7% like-for-like.
Margins reach new high, ahead of target
Net sales margins were up 0.2 margin points to a new historical high of 16.9% and increased 0.4 margin points in constant currencies, ahead of the Group’s margin target of 0.3 margin points, excluding currency. Over the last three years, reported net sales margins have improved by 0.8 margin points and by 1.2 margin points, excluding the impact of currency.
Group revenue is more weighted to the second half of the year across all regions and sectors, especially in the faster-growing markets of Asia Pacific and Latin America. As a result, the Group’s profitability and margin continue to be skewed to the second half of the year, with the Group earning approximately one-third of its profits in the first half and two-thirds in the second half.
Given the significance of Data Investment Management revenues to the Group, with none of our parent company competitors presently represented in that sector, net sales are a more meaningful measure of comparative top-line growth, although we know competitors do have significant principal media, barter, telesales, food broking and field marketing operations, where the same issue may arise. Net sales are a more appropriate measure because Data Investment Management revenue includes pass-through costs, principally for data collection, on which no margin is charged. In addition, the Group’s Media Investment Management sub-sector is increasingly buying digital media for its own account on a transparent opt-in basis and, as a result, the subsequent billings to clients have to be accounted for as revenue, as well as billings. We believe a number of our competitors face the same issue and, consequently, that reporting practices should be standardised. Thus, it is possible that revenue and the revenue growth rate could increase, whilst net sales and the net sales growth rate remain the same and, therefore, the latter presents a clearer picture of underlying performance.
Because of these two significant factors, and whilst continuing to report revenue and revenue growth, we will focus even more on our net sales margins. In 2015, the reported headline net sales margin was up 0.2 margin points to 16.9%, achieving the highest reported comparative level in the industry.
Operating costs contained
During 2015, the Group continued to manage operating costs effectively, with improvements across most cost categories, particularly staff and property costs. On a like-for-like basis, headline operating costs rose by 2.6%, less than the rate of growth for revenue and net sales.
On a like-for-like basis, the average number of people in the Group decreased by 1.9% in 2015. On the same basis, the number of people in the Group at 31 December 2015 decreased by 1.6% compared with the end of 2014. These average and point-to-point figures partly reflect the transfer of almost 1,500 staff to IBM in the first half of 2015, as part of the strategic partnership agreement and IT transformation program, together with the continuing sound management of headcount and staff costs in 2015 to balance revenue and costs. On a like-for-like basis, revenue and net sales increased by 5.3% and 3.3% respectively.
Reported staff costs, excluding incentives, increased by 3.2% and rose by over 4% in constant currency. Staff costs included £24 million ($37 million) of severance costs compared with £37 million ($63 million) in 2014. Incentive costs amounted to £331 million ($505 million), which was 16.2% of headline operating profit before incentives and income from associates, compared with £313 million ($512 million) or 16.3% in 2014. Achievement of target objectives generates 15% of operating profit before bonus as an incentive pool.
Net sales margins, before all incentives and income from associates, were 19.3%, up 0.2 margin points, compared with 19.1% last year. The Group’s staff cost-to-net sales ratio, including severance and incentives, decreased by 0.8 margin points to 63.2% compared to 64.0% in 2014, indicating an improvement in productivity.
As a result of all this, headline PBIT was up well over 5% to £1.774 billion from £1.681 billion and up well over 8% in constant currencies.
In 2015, the Group generated exceptional gains of £296 million, largely representing gains on the sale of certain Kantar internet measurement businesses to comScore Inc., the sale of the Group’s interests in e-Rewards and Chime Communications plc, together with re-measurement gains of £165 million, which included a gain of £132 million in relation to the acquisition of a majority stake in IBOPE in Latin America. These were partly offset by investment write-downs of £79 million, resulting in a net gain of £217 million, which in accordance with prior practice, has been excluded from headline profit. The Group also incurred £106 million of restructuring costs which largely comprised £52 million of severance costs, primarily in relation to certain of the Group’s Data Investment Management businesses in Western Continental Europe, and £37 million of IT transformation costs. With £29 million of one-off IT asset write-downs, this all resulted in a net exceptional gain of £82 million. After all these gains and restructuring costs, reported PBIT rose by 7% to £1.679 billion from £1.569 billion, up well over 10% in constant currencies.
Net finance costs (excluding the revaluation of financial instruments) were £152 million, down almost 10% from £168 million in 2014. This reflected the beneficial impact of lower bond coupon costs resulting from refinancing maturing debt at cheaper rates, partially offset by lower income from investments. Headline profit before tax increased by over 7% (over 11% in constant currencies) to £1.622 billion and reported profit before tax was up almost 3% (over 7% in constant currencies) to £1.493 billion, the latter reflecting lower relative levels on the revaluation of financial instruments.
The Group’s headline tax rate was 19.0%, compared with 20.0% in 2014, and on reported profit before tax was 16.6% against 20.7% in 2014. The reported tax rate is lower than the headline tax rate because most of the gains on disposals of subsidiaries and investments, and the gains on re-measurement of equity interests, are not taxable. Reported profit after tax rose by over 8% (almost 12% in constant currencies) to £1.245 billion.
Diluted headline earnings per share rose by over 10% (over 13% in constant currencies) to 93.6p and diluted reported earnings per share increased by almost 10% (over 13% in constant currencies) to 88.4p.
Parallel universes
The Group’s record performance in 2015, its fifth record year in a row, was particularly creditable given the absence of any maxi- or mini-quadrennial factors, and the slowdown in worldwide GDP growth, both nominal and real, in the second half of the year and into 2016. Pleasingly, bottom-line growth and net sales margin improvement has been particularly strong, beyond budget, target and last year. Revenue and net sales growth were also better, or similar, with all geographies and sectors (except data investment management) growing revenue and net sales on both a constant currency and like-for-like basis. Like-for-like revenue and net sales were up almost 5% and over 2% respectively in the first six months and up almost 6% and over 4% for the second half. Revenue and net sales momentum continues, with the two-year half-yearly growth rates at 13.6% and 6.4% to 13.5% and 6.6% respectively. Our operating companies are still hiring cautiously and responding to any geographic, functional and client changes in revenue – positive or negative. On a constant currency basis, headline PBIT was above budget and well ahead of last year and the increase in the net sales margin was well above the Group’s full-year target of a 0.3 margin points improvement on a constant currency basis.
Despite this strong performance, the always on, Don Draperish general industry optimism seems misplaced. To survive in the advertising and marketing services sector, you have to remain positive, indeed optimistic, seeing the glass half-full and industry and company reports generally continue, understandably, to reflect that attitude. However, general client behaviour does not reflect that state of mind, as tepid GDP growth, low or no inflation and consequent lack of pricing power encourage a focus on cutting costs to reach profit targets, rather than revenue growth. In addition, there seem to be little, if any, reason for an upside breakout from the current levels of real or nominal GDP growth, which remain stuck around 3% to 4% and below the pre-Lehman trend rate, which by definition was unsustainable. In fact, in recent months, whilst real GDP forecasts have remained steady, nominal forecasts have deteriorated significantly to under 3%, due to the strength of the US dollar, although the same pundits expect inflation (somewhat optimistically?) to increase in the coming years. In this respect, oil price reductions, the Iranian nuclear ‘armistice’ and the international currency wars have not been helpful black or grey swans. The faster growth markets of the BRICs and Next 11, located in Asia, Latin America, Africa & the Middle East and Central & Eastern Europe continue to grow faster than the slower markets of North America and Western Europe, although the growth gap has narrowed significantly as Brazil, Russia and China have slowed and the US and UK, and even some parts of Western Continental Europe, have quickened.
Brand investment drives
top-line like-for-like sales
growth, which, in turn, is the
biggest determinant of total
share owner return
Geopolitical issues remain top of business leaders’ concerns. The continuing crisis in the Ukraine and consequent bilateral sanctions, continued tensions in the Middle East and North Africa and the continuing risk, despite the negotiated agreement, of a ‘Grexit’, or even more seriously now, a ‘Brexit’ from the European Union top the agenda. Lower oil prices and first-time and continued quantitative easing in Europe and continued easing in Japan may seem to bottom or underpin the recovery and a continued, but somewhat patchy, US recovery and UK and Indian strength may help confidence. But concerns about China, aggravated by the recent renminbi devaluation and stock market decline, and Brazil remain, although we remain unabashed bulls of both.
Countries and opportunities like Indonesia, the Philippines, Vietnam, Egypt, Nigeria, Mexico, Colombia and Peru and now post-Macri Argentina add to confidence (and maybe even Cuba and Iran will), along with a mild recovery in Western Continental Europe, chiefly in Germany, Spain and Italy. France remains soft, although there are some small signs of improvement.
But there are other ‘grey swans’, chiefly three. First, will the Federal Reserve pre-Christmas tightening falter, or even reverse and what will be the further impact on bond and equity markets? Although interest rates are likely to remain lower, longer than many anticipate, due to mediocre growth rates, when the tightening comes, as it inevitably will, it may have a dramatic impact on bond and equity valuations, as recent gyrations in the markets indicate. Will continued renminbi weakness, for example, blow the Federal Reserve Bank off course from further tightening in 2016?
Secondly, the somewhat surprising result of the UK General Election (at least to the pollsters), with the Conservatives winning an overall majority, has resulted in an uncertainty-stimulating European Union referendum, now pegged for 23 June. In addition, the reduction of the still remaining, substantial, UK budget deficit, is being re-addressed in the context of a new fixed five-year political cycle.
Finally, the free fall in the oil price, although effectively a tax cut for consumers, has not resulted, it seems, in increased consumer spending, perhaps due to the lingering, psychological impact of that now infamous weekend in September 2008. Moreover, oil producing states and their sovereign wealth funds have had to pull in their investment horns, which in turn has caused concerns in relation to energy bank loans to both public and private sectors and the liquidity of banks themselves.
So all in all, whilst clients are certainly more confident than they were in September 2008 post-Lehman, with stronger balance sheets (over $7 trillion in net cash and limited leverage), sub-trend long-term global GDP growth at around 2.5% to 3.0% real and 3.5% to 4.0% nominal, combined with these levels of geopolitical uncertainty, with low inflation or fears of deflation resulting in limited pricing power, with short-term focused activist investors and strengthened corporate governance scrutiny, make them unwilling to take further risks.
They, therefore, focus on costs, rather than revenue growth. If you are trying to run a legacy business, at one end of the spectrum you have the disrupters, like Uber and Airbnb, and at the other end you have the cost-focused models like 3G or JAB in fast-moving consumer goods and Valeant and Endo in pharmaceuticals (although their models are under considerable pressure currently), whilst in the middle, towering above you, you have the activists led by such as Nelson Peltz, Bill Ackman and Dan Loeb, with a perception of stressing short-term performance – maybe they need a marketing campaign to establish they really are long term? Not surprising then, that corporate leaders tend to be risk averse. The average ‘life expectancy’ of US CEOs is around six to seven years, US CFOs around four to five years and US CMOs two years. No wonder conservatism rules.
Interestingly, the company structures that offend corporate governance with ‘geared’ voting structures, seem to be the ones that encourage more long-term strategic thinking. In these conditions, procurement and finance take the lead over marketing and investment and suppliers are encouraged to play the additional roles of banks and/or insurance companies. At best, clients focus on a strategy of adding capacity and brand building in both fast growth geographic markets and functional markets, like digital, and containing or reducing capacity, perhaps with brand building to maintain or increase market share, in the mature, slow growth markets. This approach also has the apparent virtue of limiting fixed cost increases and increasing variable costs, although we naturally believe that marketing is an investment, not a cost. We know from our own annual Millward Brown BrandZ Top 100 Most Valuable Global Brands report, that brand investment drives top-line like-for-like sales growth, which, in turn, is the biggest determinant of total share owner return. Investment in the top 10 brands from this report annually over the last 10 years would yield a total investment return 300% greater than the MSCI.
We see little reason, if any, for this pattern of behaviour to change in 2016, with continued caution being the watchword. There is certainly no evidence, based on 2015, to suggest any such change in behaviour, although one or two institutional investors, including, most notably, BlackRock, Legal & General and the UK Government, are saying that they are tiring with some companies’ total focus on short-term cost cutting and would favour strategies based more on the long-term and top-line growth and the end to quarterly reporting.
Outlook for 2016
The pattern for 2016 looks very similar to 2015, but with the bonus of the maxi-quadrennial events of the visually-stunning Rio Olympics, the UEFA Euro Football Championships and, of course, the US Presidential Election to boost marketing investments, as usual by up to 1% or so, above advertising as a proportion of GDP.
Forecasts of worldwide real GDP growth still hover around 3.0% to 3.5%, with recently reduced inflation estimates of 0.5% giving nominal GDP growth, in dollars, of even less than 3%. Advertising as a proportion of GDP should at least remain constant overall. Although it is still at relatively depressed historical levels, particularly in mature markets, post-Lehman, it should be buoyed by incremental branding investments in the under-branded faster-growing markets.
Although both consumers and corporates seem to be increasingly cautious and risk averse, the latter should continue to purchase or invest in brands in both fast and slow growth markets to stimulate top-line sales growth. Merger and acquisition activity may be regarded as an alternative way of doing this, particularly funded by cheap long-term debt, but we believe clients may regard this as a more risky way than investing in marketing and brand and hence growing market share, particularly as equity valuations have been, at least until recently, strong. The recent, potentially record, spike in merger and acquisition activity may be driven more by companies running out of cost-reduction opportunities, rather than trying to find revenue growth opportunities or synergies.
In 2016, our prime focus will remain on growing revenue and net sales faster than the industry average, driven by our leading position in the new markets, in new media, in Data Investment Management, including data analytics and the application of technology, in creativity and ‘horizontality’ – the increasing opportunities for coordination and co-operation between activities both nationally and internationally, and at a client and country level. New markets, new media and Data Investment Management account respectively for 29%, 37.5% and 20% of the Group’s revenues of $19 billion, demonstrating the success of our strategic focus.
At the same time, we will concentrate on meeting our net sales margin objectives by managing absolute levels of costs and increasing our flexibility in order to adapt our cost structure to significant market changes and by ensuring that the benefits of the restructuring investments taken in 2014 and 2015 continue to be realised.
The initiatives taken by the parent company in the areas of human resources, property, procurement, IT and practice development continue to improve the flexibility of the Group’s cost base. Flexible staff costs (including incentives, freelance and consultants) remain close to historical highs of above 8% of net sales and continue to position the Group extremely well should current market conditions deteriorate. Some commentators and analysts believe that the markets are signalling a recession. Whilst some countries may technically go into recession (i.e. two consecutive quarters of negative GDP growth), we do not believe there will be a general recession. More likely the markets are adjusting to continued low growth; so lower, longer – both growth and interest rates.
The budgets for 2016 have been prepared on a cautious basis as usual (hopefully), but continue to reflect the faster-growing geographical markets of Asia Pacific, Latin America, Africa & the Middle East and Central & Eastern Europe and faster-growing functional sectors of Advertising, Media Investment Management and direct, digital and interactive to some extent moderated by the slower growth in the mature markets of Western Continental Europe. Our 2016 budgets show like-for-like revenue growth of well over 3% and net sales growth of over 3% and a target net sales margin improvement of 0.3 margin points excluding the impact of currency.
At the time of writing, we have revenue and profit data for the first two months of 2016. The Group has had a good start to the year, with like-for-like revenue growth up over 5% in the first two months and net sales up over 3% on the same basis, again reflecting the divergence between revenue and net sales in the Group’s Media and Data Investment Management businesses.
2015 digital revenue1 vs peers $bn
All regions and sectors, except Data Investment Management, showed revenue and net sales growth, with Advertising and Media Investment Management, digital, direct and interactive and the specialist communications businesses up the strongest. These trends are in line with our budgets, which also indicate a broadly steady rate of growth throughout the year, albeit with the usual conservatism in quarter four. Operating profits and margins for the first two months were significantly above budget.
Horizontality
Including associates, the Group currently employs almost 190,000 people in over 3,000 offices in 112 countries, now including Cuba. It services 352 of the Fortune Global 500 companies, all 30 of the Dow Jones 30, 77 of the NASDAQ 100, and 830 national or multinational clients in three or more disciplines. Over 550 clients are served in four disciplines and these clients account for over 52% of Group revenue. The Group also works with 448 clients in six or more countries. These statistics reflect the increasing opportunities for horizontality – developing client relationships between activities nationally, internationally and by function. We estimate that well over a third of new assignments in the year were generated through the joint development of opportunities by two or more Group companies. Horizontality across clients, countries and regions (a strategy the Group has pursued for many years), is clearly becoming an increasingly important part of our clients’ strategies, particularly as they continue to invest in brand in slower-growth markets, and both capacity and brand in faster-growth markets.
RECMA media reviews 20151,2 Billings $bn

The Group continues to improve co-operation and coordination among its operating companies in order to add value to our clients’ businesses and our people’s careers, an objective which has been specifically built into short-term incentive plans. We have decided that up to half of operating company incentive pools are funded and allocated on the basis of Group-wide performance in 2016 and beyond. Horizontality has been accelerated through the appointment of 45 Global Client Leaders for our major clients, accounting for over one-third of total revenue of almost $20 billion, and 17 Regional, Sub-Regional and Country Managers in a growing number of ‘test’ markets and sub-regions covering 51 of the 112 countries in which we operate.
Horizontality across clients,
countries and regions (a strategy
the Group has pursued for many
years), is clearly becoming an
increasingly important part of
our clients’ strategies
The Group continues to lead the industry in coordinating communication services geographically and functionally through parent company initiatives and winning Group pitches. For example, the Group has been very successful in the recent tsunami of Media Investment Management pitches, chiefly in the US and is now ranked first by RECMA, for both net new business reviews and retentions. The swing factor between the most and least successful firms totals approximately $6 billion on net new business currently (even more including retentions) and will probably go higher in due course. This has resulted in an increase in our global Media Investment Management market share to about a third and market leadership in all regions, with North America now at around 30%.
Four core strategic priorities
Our reason for being, the justification for WPP’s existence, continues to be to add value to our clients’ businesses and our people’s careers. Our goal remains to be the world’s most admired and respected communications services advisor to global, multinational, regional and local companies.
To that end, we have four core strategic priorities.
- Advance ‘horizontality’ by ensuring our people work together for the benefit of clients, primarily through two horizontal integrators: Global Client Leaders and Regional, Sub-Regional and Country Managers.
- Increase the combined geographic share of revenues
from the faster-growing markets of Asia Pacific,
Latin America, Africa & Middle East and Central
& Eastern Europe to 40-45% of revenues.
- Increase the share of revenues from new media
to 40-45% of revenues.
- Maintain the share of more measurable marketing services – such as data investment management and direct, digital and interactive – at 50% of revenues, with a focus on the application of technology, data and content.
If we implement this strategy effectively then our business will be geographically and functionally well-positioned to compete successfully and to deliver on our long-term financial targets:
- Revenue and net sales growth greater than the industry average.
- Annual improvement in net sales margin of 0.3 margin points or more, excluding the impact of currency, depending on net sales growth and staff cost-to-net sales ratio improvement of 0.2 margin points or more.
- Annual diluted headline EPS growth of 10% to 15% delivered through revenue and net sales growth, margin expansion, acquisitions and share buy-backs.
Our six specific objectives
Here are six objectives which represent our key performance indicators (KPIs). For an assessment of how we performed against them in 2015, read on.
- Continue to improve operating margins on net sales.
- Increase flexibility in the cost structure.
- Use free cash flow to enhance share owner value and improve return on capital employed.
- Continue to develop the value added by the parent company.
- Emphasise revenue and net sales growth more as margins improve.
- Improve still further the creative capabilities and reputation of all our businesses.
1
First, to continue to improve operating margins. In 2015, we achieved a margin of 16.9% on net sales, the highest-reported level in the industry. We continue to believe a margin of well over 19% on net sales, is a tough, but realistic, objective given that our best-performing companies in each services sector have already demonstrated they can perform at a combined Group margin of 18% on net sales. The Group has embarked on a number of programs to improve operational effectiveness including process simplification, shared service centres, offshoring certain tasks to lower-cost markets and, where appropriate, outsourcing. We are consolidating IT infrastructure and services, and centralising systems development and applications to create efficiencies and focus investment. These programs are projected to deliver a 1.0 margin point benefit (excluding the impact of currency) over the course of the next two to four years, with 2016 being the first year of significant delivery.
2
Second, to increase flexibility in the cost structure. In 2015, flexible staff costs (including incentives, freelance and consultants) remained close to historical highs of above 8% of net sales and continue to position the Group extremely well should current market conditions deteriorate.
Change in variable costs %
Headline operating margins1 vs peers %

- WPP
- WPP including associates
- IPG
- Omnicom
- Publicis
- Havas
3
Third, to enhance share owner value and maximise the return on investment on the Company’s substantial free cash flow of almost £1.3 billion (or almost $2.0 billion) per annum. As capital expenditure remains relatively stable, there are broadly three alternative uses of funds: acquisitions, share buy-backs and dividends. We have increasingly come to the view, based on co-operative research with leading investment institutions, that, currently, the markets favour consistent increases in dividends and higher sustainable pay-out ratios, along with anti-dilutive progressive buy-backs and, of course, sensibly-priced small- to medium-sized strategic acquisitions.
-
Mergers and acquisitions. There is still a very significant pipeline of reasonably priced small- and medium-sized potential acquisitions, with the exception of Brazil and India and digital in the US, where prices seem to have got ahead of themselves because of pressure on our competitors to catch up. This is clearly reflected in some of the operational issues that are starting to surface elsewhere in the industry, particularly in faster-growing markets like Brazil, India and China.
Our acquisition focus in 2015 was again on the triple play of faster-growing geographic markets, new media and data investment management, including the application of technology, data and content, totally consistent with our strategic priorities in the areas of geography, new communication services and measurability. In 2015, the Group spent almost £650 million on initial acquisition payments, net of cash acquired and disposal proceeds.
Whilst talent and creativity (in the broadest sense) remain the key potential differentiators between us and our competitors, increasingly differentiation can also be achieved in three additional ways: through the application of technology, for example, Xaxis and AppNexus; through integration of data investment management, for example, Kantar and comScore; and investment in content, for example, the Group’s minority investments in Imagina, VICE, Media Rights Capital, Fullscreen, Indigenous Media, China Media Capital and Bruin Sports Capital.
Net acquisition spend is currently targeted at around £300-£400 million per annum, excluding slightly more significant ‘one-offs’, like the purchase of a controlling stake in IBOPE in Latin America and our investment in comScore. We will continue to seize opportunities in line with our strategy.
-
Dividends. As outlined in the June 2015 AGM statement, the achievement of the previous targeted pay-out ratio of 45% one year ahead of schedule, raised the question of whether the pay-out ratio target should be increased further. Following that review, your Board decided to up the dividend pay-out ratio to a target of 50%, to be achieved by 2017, and, as a result, declared an increase of almost 37% in the 2015 interim dividend to 15.91p per share, representing a pay-out ratio of 47.5% for the first half, against the traditionally lower first-half pay-out of 40% in the previous year. This has the effect of evening out the pay-out ratio between the two half-year periods and consequently balancing out the dividend payments themselves, although the pattern of profitability and hence dividend payments seems likely to remain one-third in the first half and two-thirds in the second half.
Given your Company’s strong progress, your Board has recommended an increase of 8.3% in the final dividend to 28.78p per share, which, together with the interim dividend of 15.91p per share, makes a total of 44.69p per share for 2015, an overall increase of 17.0%. This represents a dividend pay-out ratio of 47.7%, compared to a pay-out ratio of 45.0% in 2014.
It now seems possible that the newly targeted pay-out ratio of 50% will be achieved by the end of 2016, one year ahead of target. Dividends paid in respect of 2015 will total approximately £575 million.
Distributions to share owners1 £m
- Buy-backs
- Dividends paid2
6.0%
-
Share buy-backs. They continue to be targeted to absorb any share dilution from issues of options or restricted stock. However, given the net sales margin target of 0.3 margin points improvement, the targeted level of share buy-backs will be 2-3% of the outstanding share capital. If achieved, the impact on headline diluted EPS would be equivalent to an incremental improvement of 0.2 margin points.
In addition, the Company also has considerable free cash flow to take advantage of any anomalies in market values, particularly as the average 2015 net debt to EBITDA ratio was under 1.8 times, at the mid-point of our market guidance of 1.5-2.0 times. Share buy-backs in 2015 cost £588 million, representing 3.0% of issued share capital, at the top-end of our target range.
In 2015, the Company returned over £1.1 billion to share owners, including share buy-backs, an increase of 17% over 2014. Funds returned to share owners total £3.5 billion over the last five years and £5.2 billion over the last 10 years.
4
Fourth, we will continue to develop the value added by the parent company and build unique integrated marketing approaches for clients. WPP is not just a holding company focused on planning, budgeting, reporting and financial issues, but a parent company that can add value to our clients and our people in the areas of human resources, property, procurement, IT and practice development, including sustainability. We will continue to do this through a limited group of 400 or so people at the centre in London, New York, Tokyo, Hong Kong, Singapore, Shanghai and São Paulo. This does not mean that we seek to diminish the strength of our operating brands, but rather to learn from one another. Our objective is to maximise the added value for our clients in their businesses and our people in their careers.
Many of our initiatives are possible because of the scale on which we now operate. In the optimum use of property, in IT and in procurement generally, we are able to achieve efficiencies that would be beyond the reach of any individual operating company. But it is also clear that there is an increasing requirement for the centre to complement the operating companies in professional development and client coordination. It is a relatively recent development for certain multinational marketing companies, when looking to satisfy their global communications needs, to make their initial approach not to operating companies, but directly to holding or parent companies.
Such assignments present major, and increasingly frequent, opportunities for the few groups of our size. It is absolutely essential that we have the professional resources and the practice development capability to serve such clients comprehensively, actively and creatively. Initiatives involving some of the world’s largest marketers continue to gain momentum. The world’s largest advertiser is itself integrating its efforts around brands, in the areas of advertising, media investment management, market research, packaging design and public relations. For our largest client, amongst others, we have implemented a seamless model, effectively a one-client agency within our Group. All our clients, whether global, multinational or local, continue to focus on the quality of our thinking, coordination of communications and price. In response, we focus on talent, structure and incentives.
Managing talent is the priority
Talent and its management therefore remain at the heart of our reason to be: that is what our clients pay us for. Development of our people and the way we manage that talent is a critical determinant of performance and on that critical dimension, we continue to make significant progress.
In April 2015, WPP was named one of America’s 500 best employers by Forbes magazine, the only company in the communications services industry to be placed among the top 500 employers.
In developing highly-competitive incentives combined with extremely attractive working environments, we increasingly differentiate ourselves from our competitors and improve the attractiveness of WPP companies as destinations for talent. Our quarterly reviews with the operating companies have been structured to give more time and attention to talent and to clients. Our recruiting efforts throughout 2015 were especially fruitful as we successfully targeted and recruited top talent within and beyond our industry, often competing with investment banking, management consulting, new media and private equity offers. The war for talent is fierce and will intensify further, with ageing and lower birth rate demographic changes, and there is, therefore, more to be done.
The blueprint for our executive development curriculum has been completed, and our flagship client leadership training program, Maestro, now in its 13th year, is being continuously developed. The parent company and each of our operating companies have installed their own approach to performance assessment and succession planning, aimed at developing the careers of their people, improving the quality of feedback, coaching and mentoring they receive and providing for orderly succession.
Following recent events, we are, even more importantly,
focusing on gender sensitivity and the appropriateness and
effectiveness of male interactions with women. A senior management mentoring and development program, ‘The X Factor’, run by Charlotte Beers, the former chairman and CEO of Ogilvy & Mather and chairman of J. Walter Thompson, continues to prepare women for the next level of leadership in the Group and has been broadened and deepened.(More information about additional programs, including WPP Stella, appears in the Sustainability review of this report.)
In 2011, your Company teamed up with the Shanghai Art & Design Academy to establish the WPP School of Marketing and Communications. This jointly run school offers China’s first professional marketing and communications three-year diploma program. This initiative continued in 2015, with the fifth intake of 100 students.
In 2015, WPP partnered with the Indian School of Design and Innovation to offer a three-year undergraduate course on marketing communications; and, in 2016, your Company has announced the launch of the WPP Africa Academy in Johannesburg, South Africa, in collaboration with the Red & Yellow School of Logic and Magic. This initiative will enable WPP companies across Africa to access high quality, relevant and cost-effective training programs for their agency people.
After more than 20 years, the WPP Fellowship program remains (surprisingly) the only multidisciplinary and multi-geographical recruitment and training initiative in the industry, with a lower acceptance rate than Harvard Business School’s MBA program.
We continued to scrutinise and modify our compensation practices, both to offer competitive and appropriately based rewards to our people and to attract outstanding talent from elsewhere. This is a key strategic priority for us. Our competition is, sometimes, not so rigorous in evaluating and rewarding performance – for example, taking advantage of sharp falls in share prices to re-price or issue options or giving limited disclosure to investors of compensation plan details. A failure of external, as well as internal, audiences to understand the importance of globally competitive incentive-based compensation will undermine the Company’s leadership position. After all, we invest well over $10 billion a year in human capital, as opposed to only $400 million in fixed assets – 25 times more.
Communications
We aim to be a model of excellent external and internal communications, through our website content, social media channels and in print. These include: frequent tweets and regular internal emails; a monthly public news e-bulletin and company FactFiles; our multi-awarded quarterly global newspaper and e-book, The WIRE; and our annual Atticus Journal of original thinking in communications services; as well as the promotion of Group initiatives such as the Atticus Awards and Worldwide Partnership Program, BrandZ studies, and our consistently-awarded Sustainability Reports and Annual Reports.
To support WPP’s focus on horizontality, enhancements have been made to the directories and search engines on both our public website and Group intranet, enabling users to find quickly individual experts, client knowledge, company information and office locations via multiple devices. The Group intranet continues to undergo redevelopment and now holds an extensive database of WPP talent, as well as a comprehensive range of business and personal development resources.
In the first quarter of 2016, wpp.com was rated No.2 out of over 500 corporate websites assessed for accessibility by SiteMorse.
Property management
In 2015, we saw the benefit of more ‘agile working’, supported by more technology in the office environment, as our property portfolio was reduced by nearly 1% to end the year with 24.0 million square feet while net sales were up almost 6% in constant currency and average headcount grew by almost 3%. As a result, the establishment cost-to-net-sales ratio dropped by 0.2 margin points to 6.9%, contributing substantially to the Group’s overall margin improvement.
We have also ensured our new buildings are designed to focus on sustainability and we look to achieve BREEAM standard in the UK and LEED standard in the US and similar standards elsewhere. Our operating companies’ workplaces continue to be cited for their creativity, innovation and effectiveness.
2016 will see the completion of our Shanghai WPP Plaza co-location, housing 3,000 of our people, the shared space at Sea Containers House in London, housing 2,300 people, and the renovation of our shared space on Lexington Avenue in New York. These new co-location projects all meet our new planning standards and support our horizontality goal. Longer-term co-location projects are in the planning stage for New York, São Paolo and central Madrid, where the former Telefónica building will house more than 40 Group companies.
Our goal is to continue to deliver excellent work space, while reducing the portfolio further and so mitigate the impact of property inflation. Our focus on continuing to reduce the establishment cost-to-net-sales ratio will help the Group achieve its margin targets for 2016, and beyond.
Procurement
In procurement, our goal is to make savings, add value and minimise risk across all of WPP’s external spend, with particular emphasis on opportunities to leverage our scale to the benefits of our clients and our companies.
In 2015, we continued to implement and develop a spend analytics system, which now provides supplier-level and category visibility of over $5 billion of external spend, across 12 of our largest markets – the US, Canada, the UK, Germany, France, Spain, Italy, China, India, Brazil, Mexico and South Africa. Australia, Hong Kong and Singapore will be implemented in 2016. Capturing and making sense of ‘big data’ is increasingly driving procurement opportunity assessment and new project activities across the Group.
For 2016, we will continue our focus on the key drivers of supplier cost, combined with an increased emphasis on internal demand management (what we buy, why we buy and how we buy). For indirect procurement, our goal remains to have a minimum of 50% supplier spend in each major country covered by WPP preferred suppliers and contracts, and for these preferred suppliers to work with us to deliver year-on-year value improvement.
In 2015, we continued to make considerable progress in the transformation of the Group’s IT capability. In March 2015, we launched the new global IT function simultaneously with the creation of the IT shared services organisation. To demonstrate a key step towards horizontality, we successfully deployed Microsoft Office365 as our single collaboration and email platform throughout the Group. Other key achievements included establishing a single global service desk for over 150,000 IT users, to support the IT infrastructure.
Key strategic partnership agreements were signed in 2015 to transform additional IT services, including managed print and telecommunications. September 2015 marked a second landmark, where we extended our strategic partnership with IBM for the transformation of back office application support and maintenance. This phase went live in March 2016 with the transfer of service responsibility and approximately 300 people to IBM.
As a result of the IT transformation, IT costs in 2015 were held to a like-for-like growth rate that was in line with net sales growth and significantly less than revenue growth on the same basis. 2016 should see the first year of significant cost reduction.
Practice development
In practice development we continue to develop horizontal initiatives in a focused set of high-potential areas across our vertical operating brands: in Media Investment Management, healthcare, sustainability, government, new technologies, new markets, retailing, shopper marketing, internal communications, financial services and media and entertainment. Specifically, we continue to invest in sharing insights and developing initiatives through WPP Digital (in digital marketing and media), The Store (in distribution and retail) and our Government & Public Sector Practice.
In key geographic markets we are increasingly coordinating our activities through WPP Regional, Sub-Regional and Country Managers. We continue to believe that increasing coordination is required between our brands at global and country levels, as the arguments for investment in regional management become weaker, partly because of improved technology. In addition, we have increased the number of WPP Global Client Leaders to coordinate our efforts on behalf of clients and to ensure they receive maximum benefit from their relationships with WPP regional operating brands.
Furthermore, we continue to encourage internal strategic alliances and promote co-operation. Practice development initiatives have therefore been reinforced in such areas as healthcare, retail, internal communications, corporate sustainability and media and entertainment.
This has been especially important in developing our portfolio of direct investments in new media under WPP Digital and WPP Ventures and where our investments are working with our agencies and people to bring new technology capabilities and understanding to our clients.
All these initiatives are designed to ensure that we, the parent company, really do (as well as being perceived to) inspire, motivate, coach, encourage, support and incentivise our operating companies to achieve their strategic and operational goals.
5
Fifth, to emphasise revenue and net sales growth more as margins improve. One legitimate criticism of our performance against the best-performing competition has been our comparative level of organic revenue growth, although the methods used to calculate rates of organic growth ‘vary’ to say the least and we may have put too much emphasis on margin improvement. Encouragingly, our like-for-like revenue growth of 5.3% put your Company near the top-end of the pack in 2015, and followed a leading position in 2014. Net sales growth on the same basis of 3.3% was (we believe) more than respectable, given there is no standard reporting practice and so accurate comparisons with our competitors is not currently possible. Investment analysts – please demand this disclosure! Our net sales margin of 16.9% in 2015 was the highest reported level in the industry. We continue to believe that profitable growth is preferable to sacrificing margins.
Our net sales margin of 16.9% in 2015 was the highest reported level in the industry. We continue to believe that profitable growth is preferable to sacrificing margins
Estimated net new business billings of £5.6 billion ($8.6 billion) were won in 2015, with the Group first overall in net new business tables for the fourth year in a row. The Group continues to benefit from consolidation trends in the industry, winning assignments from existing and new clients, including several very large industry-leading advertising, digital, media, pharmaceutical and shopper marketing assignments. These wins partly benefited the second half of 2015, but the full benefit will be seen in 2016.
The Group has been actively engaged in the tsunami of media investment management reviews, chiefly in the US, totalling approximately $20 billion. The Group has been particularly successful in these reviews and is now ranked first by RECMA, both for net new business and retentions. There is, probably, more net new business to come, increasingly driven by the Group’s differentiation in technology, data and content.
Our practice development activities are also aimed at helping us position our portfolio in the faster-growing geographic and functional areas. The Group completed 52 acquisitions and investments in 2015: 18 were in new markets; 37 in quantitative and digital; and 8 were driven by individual client or agency needs. Out of all these transactions, 11 were in both new markets and quantitative and digital.
Specifically, in 2015, acquisitions and increased equity stakes were completed in Advertising and Media Investment Management in the US, the UK, France, Germany, the Netherlands, Turkey, South Africa, Singapore, Australia, New Zealand and Mexico; in Data Investment Management in the US, the UK, the Czech Republic, Israel and Brazil; in Public Relations & Public Affairs in the US, Germany and India; in Branding & Identity in the US and the UK; in direct, digital and interactive in the US, the UK, Belgium, Germany, Sweden, Lebanon, the UAE, South Africa, Peru and China; in Healthcare Communications in the US, the UK and Australia; and in sports marketing in the US.
A further 15 acquisitions and investments were made in the first two months of 2016, with one in Advertising and Media Investment Management; two in Data Investment Management; three in Public Relations & Public Affairs; seven in direct, digital and interactive; one in Healthcare Communications; and one in sports marketing.
These acquisitions continue to target our previously-described strategic priorities; expanding the share of revenues of our businesses in Asia Pacific, Latin America, Africa & Middle East and Central & Eastern Europe to 40-45%; in new media to 40-45%; and in Data Investment Management, direct, digital and interactive, to one-half.
Revenue in faster-growing markets 2012-2015 $bn
- WPP
- Dentsu JPN1
- Dentsu
- Omnicom2
- Publicis2
- IPG2,3
- Havas2
Organic revenue growth vs peers %

- WPP
- WPP net sales
- Dentsu1
- IPG1
- Omnicom1
- Havas1
- Publicis1
Expansion plans
We intend to expand our strong networks – J. Walter Thompson, Ogilvy & Mather, Y&R, Grey, Bates CHI&Partners, Scangroup, Mindshare, MEC, MediaCom, Maxus, tenthavenue, TNS, Millward Brown, Kantar Media, Kantar Health, Kantar Retail, Kantar Worldpanel, Hill+Knowlton Strategies, Ogilvy Public Relations, Burson-Marsteller, Cohn & Wolfe, Brand Union, Landor, FITCH, Ogilvy CommonHealth Worldwide, Sudler & Hennessey, ghg, OgilvyOne Worldwide, Wunderman, Geometry Global, POSSIBLE and AKQA – in high-growth markets or where their market share is insufficient.
We will also enhance our leadership position in Data Investment Management by further development of our key brands with particular emphasis on North America, Asia Pacific, Latin America and Continental and Eastern Europe. We will continue our growth of data panels and have established a Kantar-wide operational capability. We will reinforce our growing position in media research through Kantar Media and Kantar IBOPE Media, which include our investments in television and internet audience research and Marktest, Finpanel and CSM/CTR, and which, combined, is the market leader outside North America. Combined with our licensee partners in Europe and Asia Pacific, we currently measure television and/or internet audiences in 52 markets around the world.
In addition, we intend to reinforce our worldwide strength in direct and interactive marketing and research through our traditional channels such as Wunderman, OgilvyOne Worldwide, Geometry Global, Blanc & Otus and Lightspeed. We will also invest directly in new channels through start-ups, particularly as US and French valuations in search, for example, are still prohibitive. Other opportunities will be sought to enhance our online capabilities.
Lastly, we will continue to develop our specialist expertise in areas such as healthcare, retail and interactive and to identify new high-growth areas.
Creativity remains paramount
6
Sixth, to build on, still further, the impressive creative reputation WPP now enjoys globally.
The creative capability of the Group is led by John O’Keeffe, WPP’s worldwide creative director. John reminds us constantly that while many issues facing WPP are very important – margin growth, acquisitions, geographical spread and the like – the creative quality of the work will always be priority No.1. We live or die by the ideas we deliver to our thousands of clients: design ideas, media and digital ideas, consumer insights and, of course, Millward Brown’s influential BrandZ studies and Y&R’s equally influential BrandAsset® Valuator.
Training and development programs remain a key focus, as of course does the judicious use of our M&A skills to identify the best and most like-minded creative businesses to join us.
In 2015, we celebrated our ninth annual internal WPPED Cream awards, showcasing what we consider our very best work. wppedcream.com is a key online destination website for anyone searching for the very best in marketing creative excellence.
Maybe we should start saying that in order to be creative you need to be effective. Because we do appear to have proven both tenets
For those of us concerned with marketing that actually works, it’s common to say that, in order to be effective, you need to be creative. Maybe we should start saying that in order to be creative you need to be effective. Because we do appear to have proven both tenets. For a record fifth time in a row, our peers across the entire industry voted WPP Creative Holding Company of the Year at the Cannes International Festival of Creativity. Meanwhile, a similarly diverse Effies jury named WPP the Most Effective Holding Company, for a fourth consecutive year, and Warc named WPP the most effective Holding Company for the second year in a row. Congratulations to all the WPP companies throughout the world for another amazing year.
Assessing and managing our risks
Risk management and internal control
We recognise that the success of the strategic objectives of the Group discussed in this report depends to a significant extent on the identification, understanding of and response to the risks that the Group faces. The Board, with support from the Audit Committee, has overall responsibility for the system of internal control and risk management in the Group and has reviewed the design and effectiveness of the system during the year and up to the date of this report and carried out a robust assessment of the principal risks facing the Group. The system of controls described below is designed to manage or mitigate, but may not eliminate, the risks of failure to achieve WPP’s strategic objectives and is not an absolute assurance against material misstatement or loss.
Control environment and culture
The quality and competence of our people, their integrity, ethics and behaviour and the culture embedded within the Group are all vital to the maintenance of the Group’s system of internal control.
The Code of Business Conduct, which is regularly reviewed by the Board, sets out the principal obligations of all employees. Senior executives throughout the Group are required to sign this Code each year and all employees are required on joining the Group, and at regular intervals, to complete the WPP How We Behave, Anti-Bribery and Corruption and Privacy & Data Security Awareness training modules, which embed all of the principles of the Code in addition to operating company training programs. The WPP Policy Book which is updated with control bulletins includes required practices in many operational, tax, legal and human resource areas. Breaches or alleged breaches of the Code are investigated by the director of internal audit, head of compliance, the Group chief counsel and external advisers where appropriate. Group companies are also required to follow the Data Code of Conduct and the Supplier Code of Conduct.
The Group has an independently operated helpline, Right to Speak, to enable our people to report issues that they feel unable to raise locally, and anonymously, if necessary. Through 60 calls to this helpline, a number of issues have been raised during 2015, all of which have been followed through and investigated where appropriate and reported to the Audit Committee. The Compensation Committee continues to review how the Group’s performance rewards support the risk management and internal control systems. The adoption of clawback provisions during 2015 to take effect in 2016 and discussed in the Letter from the chairman of the Compensation Committee underline the principles of the Code of Conduct.
Risk assessment
The Group uses a three lines of defence model in relation to risk management.
First, each operating company undertakes monthly and quarterly procedures and day-to-day management activities to review their operations and business risks, supported by Group policies, training and SOX and reviews within their network.
Secondly, the operating network reviews are formally communicated to the Group chief executive, the Group finance director and senior parent company executives in monthly reports and quarterly review meetings and, in turn, to the Board. At each Board meeting, the Group chief executive presents a Brand Check review of each of the business’ operations, including an assessment of the risk in each business, providing feedback on the business risks and details of any change in the risk profile since the last Board meeting. The Brand Check includes the possibility of winning or losing major business, succession and the addition or loss of a key executive; introduction of new legislation in an important market; sustainability, including risks relating to marketing ethics, privacy and employment; political instability and changes in accounting or corporate governance practice.
Thirdly, internal audit at the Company, with Audit Committee oversight and external resource as required, provides an independent review of risk management and internal control.
Control activities and monitoring
Policies and procedures for all operating companies are set out and communicated in the WPP Policy Book, internal control bulletins and accounting guidelines. The application of these policies and procedures is monitored within the individual businesses and by the director of internal audit, head of compliance and the Group chief counsel.
Operating companies are required to maintain and update documentation of their internal controls and processes. This documentation incorporates an analysis of business risks, detailed control activities and monitoring, together with controls over security of data and the provision of timely and reliable information to management. IT and financial controls are also included.
The internal audit department was responsible for reviews and testing of the documentation and the relevant controls for a majority of the Group during 2015, the results of which were reported to the Audit Committee.
Financial reporting
Each operating company annually updates a three-year strategic plan, which incorporates financial objectives. These are reviewed by the parent company’s management and are agreed with the chief executive of the relevant operating company.
The Group operates a rigorous procedure for the development of operating company budgets, which build up the Group’s budget. During the final quarter of each financial year, operating companies prepare detailed budgets for the following year for review by the parent company. The Group’s budget is reviewed by the Board before being adopted formally. Operating company results are reported monthly and are reviewed locally, regionally and globally by the business groups and by Group management on a consolidated basis and ultimately by the Board. The results are compared to budget and the previous year, with full-year forecasts prepared and updated quarterly throughout the year.
At each year-end, all operating companies supply their full-year financial results with such additional information as is appropriate. This information is consolidated to allow the Group to present the necessary disclosures for International Financial Reporting Standards (IFRS) as adopted by the European Union and issued by the IASB.
The Disclosure Committee gives further assurance that publicly-released information is free from material omission or misstatement.
Principal risks and uncertainties
The Board has carried out a robust assessment of the principal risks and uncertainties affecting the Group as at 31 December 2015 and up to the date of this report and which are described in the table below and overleaf. These risks relate to the Group and the industry in which we operate and the strategic decisions taken by the Board. A risk dashboard and map are discussed regularly by the Audit committee and bi-annually by the Board.
|
Principal risk
|
Potential impact and any change from the prior year
|
How it is managed
|
|
Clients
|
|
The Group competes for clients in a highly-competitive and evolving industry and client loss may have a material adverse effect on the Group’s market share and its business, revenues, results of operations, financial condition or prospects.
|
The competitive landscape in the industry in which we operate is constantly evolving. Competitors include large multinational advertising and marketing communication companies and regional and national marketing services companies, database marketing and modelling companies, telemarketers, information and measurement, social media and consulting internet companies.
Service agreements with clients are generally terminable by the client on 90 days’ notice and many clients put their business up for competitive review from time to time. The ability to attract new clients and to retain or increase the amount of work from existing clients may be impacted by loss of reputation and be limited by clients’ policies on conflicts of interest.
|
Operating companies seek to establish reputations in the industry and an ethical culture that attract and retain talent and clients, including by improving the quality of their creative output and technical capability.
The Group’s different agency networks limit potential conflicts of interest and the Group’s cross-discipline team approach seeks to retain clients.
Brand Check at every Board meeting to identify the potential risk of client loss.
|
|
The Group receives a significant portion of its revenues from a limited number of large clients and the net loss of some of these clients could have a material adverse effect on the Group’s prospects, business, financial condition and results of operations.
|
A relatively small number of clients contribute a significant percentage of the Group’s consolidated revenues. The Group’s 10 largest clients accounted for 16.2% of revenues in the year ended 31 December 2015. Clients generally are able to reduce advertising and marketing spend or cancel projects on short notice. The loss of one or more of the Group’s largest clients, if not replaced by new client accounts or an increase in business from existing clients, would adversely affect the Group’s financial condition.
|
Global client account managers and the ‘Team’ model seeks to ensure the Group maintains partnership relationship with major clients. Operating companies seek to establish reputations, talent and technical capability in the industry and an ethical culture that attract and retain clients and key talent.
Brand Check at every Board meeting and regular dialogue between executive directors of the Company and directors of the Group’s largest clients.
|
|
Data security
|
|
The Group is subject to strict data protection and privacy legislation in the jurisdictions in which it operates and relies extensively on information technology systems. The Group stores, transmits and relies on critical and sensitive data such as strategic plans, personally identifiable information and trade secrets. Security of this type of data is exposed to escalating external threats that are increasing in sophistication as well as internal data breaches.
Existing and new data protection laws, in particular the GDPR in the EU concerning user privacy, use of personal information and online tracking may restrict some of the Group’s activities and increase costs.
The Group is carrying out an IT transformation project and is reliant on third parties for the performance of a significant portion of its worldwide information technology and operations functions. A failure to provide these functions could have an adverse effect on our business.
|
The Group may be subject to investigative or enforcement action or legal claims or incur fines, damages, or costs and client loss if the Group fails to adequately protect data or observe privacy legislation in every instance. A system breakdown or intrusion could have a material adverse effect on the Group’s business, revenues, results of operations, financial condition or prospects.
The risk of a data breach, cyber attack or potential infringement of data protection laws has increased in 2015.
|
The Group assists the operating companies in developing principles on privacy and data protection and compliance with local laws.
Nominated senior executives provide leadership on privacy and data protection.
Our people are required to take Privacy & Data Security Awareness training and understand the WPP Data Code of Conduct and WPP policies on data privacy and security.
The WPP Data Health Checker survey is performed annually to understand the scale and breadth of data collected by WPP agencies, so the level of risk associated with this can be assessed.
The IT transformation project will enhance the Group’s data security. In addition, the Group has established a global internal IT company responsible for providing core IT shared services to all Group companies and manage external technology providers.
|
|
Financial
|
|
The Group is subject to credit risk through the default of a client or other counterparty.
|
The Group is generally paid in arrears for its services. Invoices are typically payable within 30 to 60 days.
The Group commits to media and production purchases on behalf of some of its clients as principal or agent depending on the client and market circumstances. If a client is unable to pay sums due, media and production companies may look to the Group to pay such amounts to which it committed on behalf of those clients.
|
Evaluating and monitoring clients’ ongoing creditworthiness and in some cases requiring credit insurance or payments in advance.
The Group’s treasury position is a recurring agenda item for the Audit Committee and the Board.
|
|
Operational
|
|
The Group’s performance could be adversely impacted if it failed to ensure adequate internal control procedures are in place in relation to the Group’s increased media trading.
|
Failure to ensure that trading activities are compliant with client obligations where relevant could adversely impact client relationships and business volumes. The risks associated with media trading have increased in 2015 as the volume of trading has increased.
|
The principles of adherence to the terms of client contracts are embedded through the networks and reinforced by audits at a WPP and network level.
Regular monitoring of KPIs for trading are undertaken to identify trends and issues.
An authorisation matrix on inventory trading is agreed with the Company and the Audit Committee.
|
|
People and succession
|
|
The Group’s performance could be adversely affected if it were unable to attract and retain key talent or had inadequate talent management and succession planning for key roles at the parent and operating companies, including but not limited to the founder CEO and long-serving members of the management team.
|
The Group is highly dependent on the talent, creative abilities and technical skills of our personnel as well as their relationships with clients. The Group is vulnerable to the loss of personnel to competitors and clients leading to disruption to the business.
The founder CEO has over 30 years’ service with the Company and is identified with the success of the Group’s strategy and a failure to plan for his succession could impact investor confidence in the Company.
|
The Group’s incentive plans are structured to provide retention value, for example by paying part of annual incentives in shares that vest two years after grant date.
Operating companies seek to establish reputations in the industry that attract and retain key personnel, including by improving the quality of their creative output and by offering competitive performance-based compensation.
Succession planning for CEO, CFO and key executives of the Company is undertaken by the Board and Nomination and Governance Committee on a regular basis and a pool of potential internal and external candidates identified in emergency and planned scenarios.
Compensation Committee oversight for the Group’s incentive plans and compensation.
|
|
Regulatory, sanctions, anti-trust and taxation
|
|
The Group may be subject to regulations restricting its activities or effecting changes in taxation.
|
Changes in local or international tax rules, for example prompted by the OECD’s emerging recommendations on Base Erosion and Profit Shifting (a global initiative to improve the fairness and integrity of tax systems), or new challenges by tax or competition authorities, may expose the Group to significant additional tax liabilities or impact the carrying value of our deferred tax assets, which would affect the future tax charge.
These risks to the Group have increased in 2015.
|
The Group actively monitors any proposed regulatory or statutory changes and consults with government agencies and regulatory bodies where possible on such proposed changes.
Annual briefings to the Audit Committee of significant changes in tax laws and their application and regular briefings to the executive directors. The Group engages advisors and legal counsel to obtain opinions on tax legislation and principles.
|
|
The Group is subject to strict anti-corruption, anti-bribery and anti-trust legislation and enforcement in the countries in which it operates.
|
The Group operates in a number of markets where the corruption risk has been identified as high by groups such as Transparency International. Failure to comply or to create a corporate environment opposed to corruption or failing to instil business practices that prevent corruption could expose the Group and senior officers to civil and criminal sanctions.
|
Online and in-country ethics, anti-bribery, corruption and anti-trust training on a Group-wide basis to raise awareness and seek compliance with the WPP Code of Conduct.
Confidential, independently operated helpline for WPP staff to raise any concerns, which are investigated and reported to the Audit Committee on a regular basis.
Due diligence on acquisitions and on selecting and appointing suppliers.
Gift and hospitality register and approvals process.
|
|
The Group is subject to the laws of the US, the EU and other jurisdictions that impose sanctions and regulate the supply of services to certain countries.
|
Failure to comply with these laws could expose the Group to civil and criminal penalties including fines and the imposition of economic sanctions against the Group and reputational damage which could materially impact the Group’s results. As certain EU sanctions in relation to Iran have been lifted the risk of non-compliance has reduced since 2015.
|
Online training on a Group-wide basis to raise awareness and seek compliance and updates to Group companies on any new sanctions.
Regular briefings to the Audit Committee.
|
Longer-term viability statement
The directors confirm that they have a reasonable expectation that the Group will continue to operate and meet its liabilities, as they fall due, for the next three years. The directors’ assessment of the Group’s viability for the next three years, has been made with reference to the Group’s current position and prospects and changing competitive landscape. This period has been chosen as it aligns with our three-year plan and budget. Sensitivity analysis has been applied to reflect the potential impact of one or a combination of the principal risks on the Group and consequential contract breach, loss of reputation, client loss and inability to win new business and the impact of revenue loss. Based on the results of this analysis and the assumption that the global economy and markets continue to function and there is no flock of ‘black swans’, the directors have a reasonable expectation that the Company will be able to continue in operation and meet its liabilities as they fall due over the three-year period of their assessment.
Going concern
The directors are required to consider whether it is appropriate to prepare the financial statements on the basis that the Company and the Group are going concerns. As part of its normal business practice, the Group prepares annual and longer-term plans and in reviewing this information and, in particular, the three-year plan and budget, the directors believe that the Company and the Group have adequate resources for the foreseeable future. Therefore the Company and the Group continue to adopt the going concern basis in preparing the financial statements.
Sustainability matters
The Group’s commitment to, and investment in, sustainability supports major business wins, increases access to talent, improves efficiency and reduces risks to our business. We estimate that clients who engaged with WPP on our approach to sustainability were worth £1.29 billion out of our total revenues of £12.2 billion to the Group in 2015.
We are in business for the long term and, like all leading companies today, we recognise our wider responsibilities and the opportunity to generate value for share owners, clients, our people and the world at large through our business. Sustainability at WPP cuts across all areas: from the work we do for clients, to the time we donate to causes through pro bono work, the way we run our Company and look after our people, and our commitment to respect human rights. Sustainability issues are ever more important to our clients and, as they feel the impact of long-term demographic, environmental and social trends, they need a marketing services provider who understands the changing landscape and shares their values. Our track record on sustainability gives us credibility.
A summary of the Group’s approach to sustainability can be found here, including our commitment to respect human rights. Please also see our annual Sustainability Report on the work our clients and our people do in this important area.
Sustainability performance summary
| |
2015
|
2014
|
2013
|
|
Value of client business supported by our sustainability credentials1
|
£1.29bn
|
£1.35bn
|
£1.26bn
|
|
Gender diversity (% female employees)
|
54%
|
54%
|
54%
|
|
Gender diversity (% female executive leaders)
|
33%
|
31%
|
32%
|
|
Investment in training
|
£41.1m
|
£38.2m
|
£40.0m
|
|
Carbon footprint (tonnes of CO2 per employee)
|
2.07
|
2.28
|
2.35
|
|
Social contribution2
|
£43.8m
|
£46.9m
|
£39.4m
|
And finally...
WPP companies have always been conscious of the need for diversity in the workplace; and not just out of a sense of moral responsibility, which we take very seriously. On behalf of their clients, our companies’ people are responsible for understanding, and appealing to, just about every one of the world’s seven billion citizens. And while we have never believed that only a teenager can understand a teenager or only a pensioner can understand a pensioner, there can be no doubt that diversity among our people is a professional necessity. For us, diversity is not simply a question of race, colour or gender; at least as important is a diversity of attitude, of mind-set, of ways of approaching problems. Uniform, conventional thinking will never of itself meet the demands of our clients. Clearly, given recent
event at one of our operating companies, we have to
redouble our efforts to emphasise the importance and
acceptance of diversity across the Group.
The results reported here, presented in dispassionate numbers, are all the product of the inventive work of tens of thousands of talented individuals – and with no two alike. They come from countless different backgrounds and have countless different ways of looking at the world. They embody skills that range from the statistician to the screenwriter. They represent perhaps the most diverse example of diversity of any single organisation.
We welcome this opportunity to salute them all and thank them for everything they have done to make 2015, another record year, as good a year as it has been.

Roberto Quarta
Chairman

Sir Martin Sorrell
Group chief executive

Paul Richardson
Group finance director
In Memoriam: Roger Agnelli

Roger Agnelli
1959-2016
We mourn the loss of Roger Agnelli, his wife Andréia, son, João, daughter, Anna Carolina and their spouses – along with their pilot – in a tragic aircraft accident in São Paulo on 19 March 2016. Roger had been a WPP Board director since 2013.
We miss his insight, charm, humour and smile – a true Brazilian.
Forward-looking statements
In connection with the provisions of the Private Securities Litigation Reform Act of 1995 (the ‘Reform Act’), the Company may include forward-looking statements (as defined in the ‘Reform Act’) in oral or written public statements issued by or on behalf of the Company. These forward-looking statements may include, among other things, plans, objectives, projections and anticipated future economic performance based on assumptions and the like that are subject to risks and uncertainties. As such, actual results or outcomes may differ materially from those discussed in the forward-looking statements. Important factors which may cause actual results to differ include but are not limited to: the unanticipated loss of a material client or key personnel, delays or reductions in client advertising budgets, shifts in industry rates of compensation, regulatory compliance costs or litigation, natural disasters or acts of terrorism, the Company’s exposure to changes in the values of other major currencies (because a substantial portion of its revenues are derived and costs incurred outside of the UK) and the overall level of economic activity in the Company’s major markets (which varies depending on, among other things, regional, national and international political and economic conditions and government regulations in the world’s advertising markets). In addition, you should consider the risks described under the heading Principal risks and uncertainties, which could also cause actual results to differ from forward-looking information. In light of these and other uncertainties, the forward-looking statements included in this document should not be regarded as a representation by the Company that the Company’s plans and objectives will be achieved. The Company undertakes no obligation to update or revise any such forward-looking statements, whether as a result of new information, future events or otherwise.