Thirty years ago WPP began its transformation from a maker of shopping baskets and teapots into the world leader in advertising and marketing services. The traditional gift for a 30th anniversary is a pearl – an object with particular significance for our Group.
In 1996, I gave the D&AD (Design and Art Direction) President’s Lecture in London. D&AD is the association and charity that promotes excellence in commercial creativity, and a yellow, white or black pencil at its annual awards is one of the highest honours our industry can bestow.
In that speech I said: “What we sell are pearls (of wisdom, of beauty, of desire, of wonder). Whether we are designers or planners or writers or art directors or corporate strategists, our raw material is knowledge. We turn that knowledge into ideas, insights, and objects that have a material, quantifiable value to our clients.”
The pearls we produce have created rather a lot of quantifiable value for our share owners, too. And the longer you’ve been a share owner, the greater that value is likely to be.
Warren Buffett famously warned Berkshire Hathaway shareholders of the dangers of short-term thinking. “If you aren’t willing to own a stock for 10 years,” he said, “don’t even think about owning it for 10 minutes.”
Sadly, champions of the long view are becoming harder to find – in the investment community and in the boardroom.
BlackRock’s Larry Fink, the world’s most influential institutional investor, was concerned enough to write to every company in the S&P 500 last year.
This is what he had to say: “Many commentators lament the short-term demands of the capital markets. We share those concerns, and believe it is part of our collective role as actors in the global capital markets to challenge that trend… It concerns us that, in the wake of the financial crisis, many companies have shied away from investing in the future growth of their companies.”
Fink hits the nail on the head. Executives are still haunted by the collapse of Lehman Brothers and the events that followed.
Boardrooms (in the West at least) are more likely to be inhabited by the ghosts of Lehman than John Maynard Keynes’ animal spirits.
Investment has become more closely associated with risk than opportunity, and firms are sitting on an estimated cash pile of $7 trillion worldwide as a result, together with unleveraged balance sheets.
Compounding the problem is a widespread and confidence-sapping sense of uncertainty – the result of a stuttering global economic recovery and an ever-growing number of geopolitical flashpoints.
In this world of caution and conservatism, the departments whose job is to drive a company’s growth (like marketing and product development) have lost influence to those whose job is to keep a close eye on expenditure (like finance and procurement).
Consequently, targets are often reached not by maximising revenues, but by minimising costs – including marketing spend.
This is entirely understandable, but entirely counter-productive. Sustained investment (for that is what it is) in marketing communications is essential for the enduring success and profitability of brands.
The engine of commerce
Clearly, I am not exactly a disinterested observer, so don’t take my word for it. In January 2015, analysts from Credit Suisse published a research note on consumer staples (food, drinks, household items, etc.) that vividly illustrated the power of brand communications.
The report highlights the direct correlation between the growth rates of various firms and their spending on advertising, and reveals that those cutting spending most severely have suffered most in terms of their financial performance.
According to the analysts, “The importance of brand investment should not be underestimated. Higher spend can translate into higher growth and market share as well as improved gross margins and return on invested capital (ROIC). In turn, higher ROIC has historically led to higher stock market valuations. Cutting media spend often has the inverse effect.”
They do not stop there. Advertising spend is not just important – it’s the single most important thing a company can do to grab a bigger slice of the pie: “In our opinion, the importance of spending on advertising is critical to long-term sustainable growth, and therefore, shareholder value… the sustained and steady rise in media spend is, in our opinion, the dominant influence in growing market share.”
US advertising spend by company 2014 $m
US advertising spend by company
| 2014 rank |
2013 rank |
Company |
2014 |
2013 |
% change |
|
Source: Kantar Media
|
| 1 |
1 |
Procter & Gamble |
$2,642.2 |
$3,081.1 |
-14.2% |
| 2 |
2 |
General Motors |
$1,648.9 |
$1,795.7 |
-8.2% |
| 3 |
3 |
AT&T |
$1,637.8 |
$1,868.7 |
-12.4% |
| 4 |
4 |
Comcast |
$1,550.2 |
$1,648.0 |
-5.9% |
| 5 |
7 |
Berkshire Hathaway |
$1,431.3 |
$1,258.3 |
13.7% |
| 6 |
5 |
L’Oréal |
$1,425.2 |
$1,554.8 |
-8.3% |
| 7 |
9 |
Pfizer |
$1,400.6 |
$1,138.9 |
23.0% |
| 8 |
8 |
Verizon Communications |
$1,284.4 |
$1,224.6 |
4.9% |
| 9 |
6 |
Toyota |
$1,198.3 |
$1,268.8 |
-5.6% |
| 10 |
– |
Fiat Chrysler Automobiles |
$1,133.3 |
$1,169.0 |
-3.1% |
| 11 |
13 |
Johnson & Johnson |
$1,041.0 |
$976.6 |
6.6% |
| 12 |
10 |
Time Warner |
$999.3 |
$883.4 |
13.1% |
| 13 |
14 |
McDonald’s |
$951.3 |
$993.8 |
-4.3% |
| 14 |
15 |
Softbank |
$919.2 |
$930.7 |
-1.2% |
| 15 |
16 |
Wal-Mart |
$900.2 |
$898.4 |
0.2% |
| 16 |
18 |
Nissan |
$865.9 |
$870.2 |
-0.5% |
| 17 |
– |
Deutsche Telekom |
$863.2 |
$800.3 |
7.9% |
| 18 |
17 |
Walt Disney |
$848.2 |
$876.5 |
-3.2% |
| 19 |
20 |
Yum! Brands |
$836.1 |
$859.4 |
-2.7% |
| 20 |
11 |
Ford Motor Co |
$835.8 |
$1,127.9 |
-25.9% |
None of this, as the report says, should come as a surprise. There are countless industry, academic and client-approved case studies that make the same point: marketing (along with its associated services) is the engine of commerce.
Rejecting the economics and politics of laissez-faire, and the faith in unfettered markets to solve all problems in the fullness of time, Keynes the interventionist noted drily that “in the long run, we are all dead.”
As the Credit Suisse analysis makes abundantly clear, an obsessive corporate focus on the short run poses a more immediate health risk.
Challenging year, record year
Despite the challenges, our business performed well in 2014, which was another record year in terms of revenues and profitability.
We expect the pattern for 2015 to be much the same: a bit of a slog, but a satisfactory result at the end of it, ahead of last year’s record performance.
Spending on advertising and marketing services closely tracks GDP and if this trend continues throughout 2015, as we anticipate it will, it should be a reasonable year for the industry.
Current forecasts indicate a growth rate of around 5.0% in nominal worldwide GDP and, risk-aversion notwithstanding, corporates will continue to invest in brands, both in mature and fast-growing economies.
Brand investment is generally boosted by major four-yearly events (typically global sporting competitions and US elections).
2014 was a ‘mini-quadrennial’ year with the Sochi Winter Olympics, the FIFA World Cup in Brazil and the mid-term Congressional elections, and while 2015 is without such events, we are gearing up towards a ‘maxi-quadrennial’ 2016 featuring the Rio Olympics, the UEFA European Football Championship and the US Presidential Election.
Worldwide communications services expenditure 2014 $m
Worldwide communications services expenditure 2014 $m
| |
Advertising |
Market research |
Public relations |
Direct & specialist communications |
Sponsorship |
Total |
|
Source: GroupM
Note: Healthcare communications ($4.8 billion) is distributed pro-rata in Direct & specialist communications.
|
| North America |
181,719 |
16,200 |
4,140 |
98,075 |
20,600 |
320,734 |
| Latin America |
29,876 |
2,050 |
455 |
35,571 |
4,200 |
72,152 |
| Europe |
115,714 |
16,150 |
2,550 |
106,713 |
14,800 |
255,927 |
| Asia Pacific |
167,604 |
6,300 |
4,550 |
52,848 |
13,300 |
244,602 |
| Africa & Middle East |
17,776 |
700 |
155 |
2,033 |
2,300 |
22,964 |
| Total |
512,689 |
41,400 |
11,850 |
295,240 |
55,200 |
916,379 |
BrandZ™ Top 10 most valuable global brands 2014
| Rank |
Brand |
Category |
Brand value 2014 $m |
Year-on-year change |
|
Source: BrandZ/Millward Brown Vermeer
Note: 2015 global rankings available after 27 May 2015.
|
| 1 |
Google |
Technology |
158,843 |
40% |
| 2 |
Apple |
Technology |
147,880 |
-20% |
| 3 |
IBM |
Technology |
107,541 |
-4% |
| 4 |
Microsoft |
Technology |
90,185 |
29% |
| 5 |
McDonald’s |
Fast food |
85,706 |
-5% |
| 6 |
Coca-Cola |
Soft drinks |
80,683 |
3% |
| 7 |
Visa |
Credit card |
79,197 |
41% |
| 8 |
AT&T |
Telecoms |
77,883 |
3% |
| 9 |
Marlboro |
Tobacco |
67,341 |
-3% |
| 10 |
Amazon |
Retail |
64,255 |
41% |
Grey swans gathering
These positive stimuli to corporate and consumer confidence have to compete with a bewildering array of largely geopolitical risks.
The already sizeable flock of grey swans (known unknowns), including the Eurozone’s continued fragility, the prospects for the Middle East, the slowdown in the BRICs economies and the US deficit, has been swelled further by the arrival of several black swans (unknown unknowns) in the form of ISIS, Ebola, Ukraine, the demonstrations in Hong Kong and the Sino-Japanese territorial dispute over the Diaoyu/Senkaku islands.
More parochially, the threat of Britain leaving the European Union after a possible referendum in 2016 or 2017 is a dark cloud on the horizon for UK business.
A G2 world
Our home market of the UK (WPP’s second largest after the US) has been a star performer in recent years, to some extent reflecting the relative strength of the British economy in comparison with other European nations.
However, the weakness of Western Continental Europe, alongside slower growth in some of the BRICs markets, has left us with a global economy increasingly dominated by the ‘G2’ of the US and China – in the short term at least.
Conversations with clients suggest they are very focused on the two giants, and expect them to drive much of their companies’ growth in 2015.
We have been a bull on China for more than 25 years. The People’s Republic is now WPP’s third largest market, with revenues of $1.5 billion and 15,000 people. While its rate of expansion has decreased, its re-emergence as a global superpower is no longer in question.
The flotation of Alibaba, which made it one of the most valuable companies on the planet, has forced Chinese business into the Western public consciousness.
Although Chinese companies have traditionally (and rightly) concentrated on their enormous domestic market, an increasing number – including Xiaomi, the innovative handset maker that has taken on and beaten Apple and Samsung – are getting the itch to expand internationally. We expect this trend to continue.
Meanwhile, despite its seemingly endless wrangling with the deficit, the US has enjoyed a good financial press recently. Employment figures, retail sales and manufacturing production are all moving in the right direction.
Expectations of long-term energy self-sufficiency and a burgeoning high-value manufacturing sector (in particular driven by capital-intensive robotics and 3D printing) mean the prospects for the US are good.
Four strategic priorities
In a changing and uncertain world, some things remain constant. Our steady strategic focus on four principal themes – new markets, new media, data investment management and the application of technology, and ‘horizontality’ – has served the Group well.
111 countries and still counting... !
In 2014 WPP entered its 111th country with an acquisition in Mongolia. Although many of the so-called BRICs, Next 11 and other ‘new’ markets are out of fashion within the financial community, having seen growth slacken, we are less fickle.
The middle class will continue to expand in non-Western economies, leading to greater consumption of goods and services, and greater spending on marketing services by brands.
... we lead the industry in the application of technology to marketing – both through our wholly-owned businesses and a growing number of strategic investments in innovative tech companies
For businesses like ours, therefore, these markets are essential to future development and exposure to them continues to be a strength, not a weakness.
We expect such territories to account for between 40-45% of our business within the next five years.
Digital marches on
According to WPP’s Media Investment Management arm, GroupM, digital accounted for about a quarter of global advertising budgets in 2014, which they expect to rise to nearly 28% this year.
The relentless growth of new media has been accompanied by an equivalent decline in traditional print (newspapers and magazines, involving felling trees and distributing newsprint), now at roughly 20%. Free-to-air or linear TV is relatively solid at around 40%, although there are hints it could finally be weakening.
At WPP we pinned our colours to the digital mast at an early stage, and continue to reap the benefits. Digital now stands at 36% of all revenues, which we aim to increase to 40-45% within five years.
Digital technologies have created an explosion in demand for high-quality content, and here, too, we are ahead of the pack
As this year’s Consumer Electronics Show in Las Vegas demonstrated, technology – and how we use it – is changing faster than ever. Our default position is to be as paranoid as possible about what this means for our business.
As a result, we lead the industry in the application of technology to marketing – both through our wholly-owned businesses and a growing number of strategic investments in innovative tech companies.
Xaxis is the world’s largest programmatic media and technology platform, directing more than $770 million of audience-targeted media buys across 40 markets in North America, Europe, Asia Pacific, Latin America and the Middle East, and managing over two trillion impressions annually. It’s a wholly owned business that, on the basis of current market valuations, would be worth over $4 billion by itself.
Cementing our leadership position in ad tech, last year we injected part of Xaxis into AppNexus, the world’s largest independent platform in the field, and took a significant stake in the business. With Google selling Google via DoubleClick and Facebook selling Facebook via Atlas, clients need an agnostic, independent platform and little can compete with AppNexus and Xaxis in that respect.
Digital technologies have created an explosion in demand for high-quality content, and here, too, we are ahead of the pack. In 2014, we invested in next-generation digital content studio Indigenous Media – a new venture founded by award-winning film-makers Jon Avnet, Rodrigo Garcia and Jake Avnet.
It joins other investments including Media Rights Capital, which (among many other things) developed the House of Cards series for Netflix; youth-focused online content company VICE, in which we have a stake valued at approximately $300 million; and Fullscreen, the leading YouTube network with 375 million subscribers.
Principal sources of annual media growth 2015f
| |
Contribution
$m |
Contribution
% |
|
Source: GroupM
f: Forecast.
|
| Asia Pacific (all) |
11,390 |
45.3 |
| North Asia |
7,625 |
30.4 |
| China |
7,129 |
28.4 |
| North America |
6,963 |
27.7 |
| US |
6,666 |
26.5 |
| Latin America |
2,886 |
11.5 |
| Western Europe |
2,428 |
9.7 |
| Brazil |
1,691 |
6.7 |
| Middle East & Africa |
1,436 |
5.7 |
| UK |
1,321 |
5.3 |
| ASEAN |
1,289 |
5.1 |
| Japan |
985 |
3.9 |
| India |
888 |
3.5 |
| Australia |
469 |
1.9 |
| Israel |
461 |
1.8 |
| Colombia |
376 |
1.5 |
| Hong Kong |
375 |
1.5 |
| Argentina |
363 |
1.4 |
| Indonesia |
309 |
1.2 |
| Vietnam |
300 |
1.2 |
| Canada |
297 |
1.2 |
| Nigeria |
291 |
1.2 |
| Spain |
286 |
1.1 |
| Philippines |
280 |
1.1 |
| Mexico |
276 |
1.1 |
| Germany |
258 |
1.0 |
| South Africa |
253 |
1.0 |
| GCC and Pan Arab |
201 |
0.8 |
| South Korea |
25 |
0.1 |

Not so dim
Last year we renamed our Consumer Insight or market research business as Data Investment Management (yes, DIM for short). The point of the rebrand was more accurately to represent what the Kantar family of businesses does for its clients – namely investing in data collection and analysis on their behalf (and achieving the best possible returns).
It was also a reflection of Kantar’s ever-closer relationship with our Media Investment Management business, under the umbrella of GroupM. None of our competitors has its own data business, which gives us a huge advantage in terms of what we can offer clients.
Our recent partnership with Rentrak, the fast-growing, US-based film and TV measurement company, is a perfect illustration of how intertwined our media and data investment functions have become.
Both Kantar Media, our media research and analytics business, and GroupM entered into the agreement. Rentrak integrated its national and local TV measurement with a number of Kantar’s US-based services that focus on digital
None of our competitors has its own data business, which gives us a huge advantage in terms of what we can offer clients
media and purchasing data, providing advertisers, agencies and TV networks with even more powerful tools to understand consumer behaviour.
GroupM and its agencies gained full access to Rentrak’s TV viewing information, allowing them to further refine TV targeting and increase the medium’s effectiveness and value to our clients.
Worldwide, our Data Investment Management arm (including associates) now employs over 34,000 people, and in revenue terms it’s just under a quarter of our business. Collectively, quantitative disciplines (data and digital) account for 51% of WPP’s overall turnover. These proportions are about right strategically at current levels.
Growth of media in major markets 2010-2015 %
| Internet |
2010 |
2011 |
2012 |
2013 |
2014f |
2015f |
| North America |
11.1 |
12.5 |
10.4 |
9.8 |
12.1 |
16.2 |
| Latin America |
35.1 |
33.8 |
23.3 |
8.0 |
16.7 |
24.1 |
| Western Europe |
16.6 |
14.6 |
9.7 |
11.2 |
10.5 |
9.8 |
| Central & Eastern Europe |
49.0 |
31.0 |
28.5 |
20.4 |
12.0 |
7.0 |
| Asia Pacific (all) |
24.1 |
26.9 |
26.8 |
28.8 |
25.2 |
24.0 |
| North Asia1 |
45.3 |
47.3 |
38.8 |
40.2 |
31.2 |
29.9 |
| ASEAN2 |
47.2 |
7.6 |
59.9 |
54.0 |
45.9 |
40.0 |
| Middle East & Africa |
8.9 |
5.7 |
56.7 |
6.9 |
4.8 |
20.3 |
| World |
16.4 |
17.1 |
15.4 |
15.7 |
15.7 |
17.2 |
| Television |
2010 |
2011 |
2012 |
2013 |
2014f |
2015f |
| North America |
4.4 |
3.6 |
3.8 |
0.9 |
3.3 |
1.2 |
| Latin America |
20.4 |
5.0 |
11.1 |
6.0 |
11.2 |
9.5 |
| Western Europe |
8.6 |
0.5 |
-6.1 |
0.3 |
2.6 |
2.6 |
| Central & Eastern Europe |
10.9 |
11.2 |
3.0 |
4.0 |
2.0 |
0.4 |
| Asia Pacific (all) |
8.2 |
8.3 |
5.8 |
4.4 |
2.7 |
1.9 |
| North Asia1 |
9.3 |
11.2 |
6.0 |
3.0 |
0.6 |
-1.4 |
| ASEAN2 |
14.6 |
14.3 |
13.7 |
16.3 |
8.2 |
10.7 |
| Middle East & Africa |
21.7 |
5.8 |
14.0 |
7.3 |
0.3 |
7.2 |
| World |
8.2 |
5.1 |
3.9 |
2.8 |
3.5 |
2.6 |
| Outdoor |
2010 |
2011 |
2012 |
2013 |
2014f |
2015f |
| North America |
1.4 |
2.7 |
3.6 |
3.3 |
-0.7 |
0.9 |
| Latin America |
13.4 |
12.8 |
14.5 |
0.1 |
10.2 |
17.1 |
| Western Europe |
2.1 |
-1.9 |
-4.4 |
0.5 |
0.5 |
1.5 |
| Central & Eastern Europe |
7.6 |
8.8 |
3.8 |
3.5 |
-4.1 |
-5.4 |
| Asia Pacific (all) |
7.8 |
11.5 |
12.5 |
5.4 |
5.3 |
2.9 |
| North Asia1 |
17.2 |
23.5 |
18.4 |
6.5 |
7.5 |
4.5 |
| ASEAN2 |
8.9 |
9.1 |
17.7 |
5.6 |
0.8 |
6.6 |
| Middle East & Africa |
19.9 |
44.6 |
22.9 |
1.9 |
2.0 |
13.4 |
| World |
5.6 |
7.3 |
7.0 |
3.6 |
3.0 |
3.0 |
| Magazines |
2010 |
2011 |
2012 |
2013 |
2014f |
2015f |
| North America |
-3.2 |
-0.1 |
1.9 |
0.0 |
-3.9 |
-2.9 |
| Latin America |
10.4 |
7.0 |
-0.4 |
-10.8 |
-6.6 |
3.2 |
| Western Europe |
-2.6 |
-5.1 |
-11.6 |
-9.3 |
-5.6 |
-3.6 |
| Central & Eastern Europe |
-2.6 |
1.3 |
-3.7 |
-11.4 |
-11.2 |
-11.2 |
| Asia Pacific (all) |
2.8 |
2.0 |
0.6 |
-2.3 |
-8.3 |
-6.3 |
| North Asia1 |
17.4 |
13.1 |
5.5 |
-1.3 |
-11.2 |
-7.7 |
| ASEAN2 |
11.6 |
4.2 |
-1.8 |
-5.6 |
-7.2 |
-2.0 |
| Middle East & Africa |
5.5 |
2.4 |
-11.8 |
9.9 |
-0.6 |
7.5 |
| World |
-1.8 |
-0.9 |
-2.1 |
-3.0 |
-5.1 |
-3.4 |
| Radio |
2010 |
2011 |
2012 |
2013 |
2014f |
2015f |
| North America |
-3.0 |
2.3 |
4.3 |
0.1 |
-3.1 |
-3.1 |
| Latin America |
12.3 |
8.5 |
-5.2 |
1.1 |
5.7 |
8.6 |
| Western Europe |
1.1 |
0.3 |
-3.5 |
-2.6 |
2.8 |
1.7 |
| Central & Eastern Europe |
3.5 |
6.4 |
7.1 |
2.9 |
1.2 |
-3.4 |
| Asia Pacific (all) |
11.9 |
3.3 |
4.6 |
-2.1 |
2.4 |
2.7 |
| North Asia1 |
23.8 |
7.9 |
7.0 |
2.0 |
3.4 |
2.4 |
| ASEAN2 |
15.7 |
1.8 |
9.2 |
-25.2 |
5.5 |
7.2 |
| Middle East & Africa |
20.0 |
14.8 |
35.3 |
5.3 |
-2.7 |
12.1 |
| World |
3.4 |
3.2 |
3.3 |
-0.5 |
0.3 |
1.2 |
| Cinema |
2010 |
2011 |
2012 |
2013 |
2014f |
2015f |
| North America |
10.5 |
4.8 |
4.5 |
4.3 |
-16.7 |
15.0 |
| Latin America |
-5.6 |
26.3 |
9.9 |
8.2 |
5.9 |
11.9 |
| Western Europe |
5.8 |
-0.6 |
3.1 |
-9.7 |
0.2 |
3.2 |
| Central & Eastern Europe |
22.5 |
11.9 |
9.6 |
10.5 |
0.6 |
-0.9 |
| Asia Pacific (all) |
15.8 |
1.4 |
11.4 |
-7.5 |
0.0 |
8.5 |
| North Asia1 |
5.0 |
3.9 |
0.0 |
4.2 |
4.0 |
4.6 |
| ASEAN2 |
18.1 |
15.4 |
10.8 |
-25.7 |
1.8 |
5.8 |
| Middle East & Africa |
7.4 |
41.8 |
-0.7 |
1.4 |
21.2 |
9.0 |
| World |
7.7 |
4.6 |
5.6 |
-5.3 |
1.8 |
5.6 |
| Newspapers |
2010 |
2011 |
2012 |
2013 |
2014f |
2015f |
|
Source: GroupM
f: Forecast.
1 China, Hong Kong, South Korea, Taiwan.
2 Indonesia, Malaysia, the Philippines, Singapore, Thailand, Vietnam.
(Figures rounded up.)
|
| North America |
-10.4 |
-6.5 |
-4.7 |
-4.3 |
-4.5 |
-3.6 |
| Latin America |
14.4 |
4.6 |
14.7 |
-11.5 |
0.6 |
2.9 |
| Western Europe |
-2.1 |
-3.4 |
-10.3 |
-9.9 |
-7.9 |
-6.7 |
| Central & Eastern Europe |
1.3 |
2.4 |
-1.4 |
-8.6 |
-10.8 |
-5.3 |
| Asia Pacific (all) |
9.9 |
0.4 |
-2.6 |
-2.5 |
-6.7 |
-2.4 |
| North Asia1 |
17.2 |
4.1 |
-4.1 |
-3.7 |
-9.8 |
-4.7 |
| ASEAN2 |
20.3 |
6.3 |
1.3 |
8.2 |
-5.2 |
3.1 |
| Middle East & Africa |
-1.3 |
-1.2 |
-4.5 |
1.3 |
-3.5 |
3.4 |
| World |
-0.8 |
-2.6 |
-4.8 |
-5.5 |
-6.0 |
-3.3 |
Team WPP
We are fortunate to have some of the most celebrated agencies in the industry, all of which continue to be successful in their own right.
At the same time we have pioneered a more collaborative and integrated approach to servicing clients through our ‘Team’ model, in which people from different WPP agencies work together on an ever-growing number of accounts.
This model is a response to client demand: a desire to access the best talent, regardless of where it sits within the Group, and to work through a single point of contact in the form of a global client leader – in essence, effectiveness and efficiency.
WPP is the only communications services group that makes horizontality a core part of its strategy. As our new business record shows, this is a source of real differentiation and competitive advantage
Integrated teams now advise more than 40 clients worldwide (accounting for over a third of WPP’s revenues). Among them are Ford, Colgate, Mazda, Bank of America, MillerCoors, Pfizer, GlaxoSmithKline, Huawei and Chanel. We estimate that well over a third of new assignments in 2014 were generated through the joint development of opportunities by two or more Group companies.
The individual companies, networks and disciplines are the verticals of our business, so we call cross-Group working ‘horizontality’ – an approach that doesn’t stop with client teams.
We have an increasing number of Regional, Sub-Regional and Country Managers whose job is to marshal resources and foster collaboration for the benefit of clients, to help identify local new business opportunities and potential acquisitions and investments, and to support efforts to attract and retain the best talent.
WPP Regional, Sub-Regional and Country Managers
- Covering 50 out of 111 countries
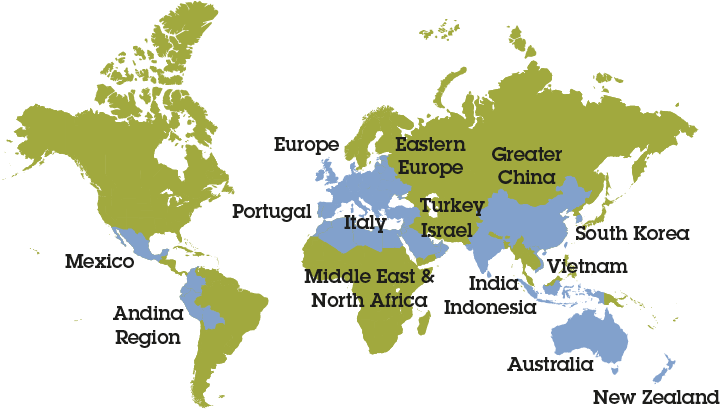
WPP is the only communications services group that makes horizontality a core part of its strategy. As our new business record shows, this is a source of real differentiation and competitive advantage.
Pitch perfect
If new business wins are a barometer of corporate well-being, then we enjoyed robust health in 2014. The performance of our agencies kept WPP consistently at the top of the ‘pitches won’ tables.
Far too numerous to list in full, the most significant included Mars (MediaCom), Vodafone (MEC), Papa John’s (Grey), Anheuser-Busch InBev (MediaCom), Burger King (David), Pepsi China (Mindshare), NBC (Maxus), Tiffany (Ogilvy), Miller Lite (Cavalry), GSK (Wunderman), Bayer (JWT), L’Oréal (MEC), Estée Lauder (Johannes Leonardo) and the UK Government (RKCR/Y&R).
This record is no accident. We believe that our firms – whether in advertising, media investment management, digital, branding, PR, healthcare or data – are the places where the best people in our industry (and beyond) want to work. I’d like to thank every one of them for their individual contribution to our collective success.
Magic not just metrics
When we win a piece of business, what exactly is the client buying from us? In practical terms it differs every time, of course, but in essence what we offer is applied creativity.
Creativity (insight, imagination, wit, ingenuity, vision, inventiveness – call it what you like) applied in a business setting to achieve commercial goals. And creativity in the broadest sense, not just the traditional crafts of ‘art and copy’. The successful practice of every one of our marketing services disciplines requires creative thought and talent.
There are dangers in defining yourself as a creative business, not least at a time when – as I say in my introduction – the finance director has disproportionate influence in client boardrooms. All too often, spending on intangibles (and what greater intangible than creativity?) falls squarely into the risk category.
This approach is a huge brake on innovation, and the world’s leading business thinkers are lining up to say so.
Investment in intangible assets like design, branding, marketing, research, training and software development is widely regarded as a proxy for a company’s or a nation’s investment in innovation, because it is these things that drive experimentation, invention and, ultimately, growth.
Clay Christensen, the influential author and Harvard Business School Professor, recently highlighted the folly of a one-eyed focus on metrics like internal rate of return.
He estimates that 50-90% of managers’ time is spent on “the assembly of numbers” and believes that “because we focus on that rather than focus on innovations, growth slows.” He points to decades of Japanese stagnation as an example of what happens when an economy decides to worship in “the church of new finance.”
While we are very proud to have won four consecutive awards for most creative holding company at the Cannes International Festival of Creativity, we are equally – if not more – pleased to have won four consecutive Effies for being the most effective group, too
The Rotman School of Management’s Roger Martin, another celebrated commentator, has a similar view. He makes the case for the “appreciation of qualities” as well as quantities, the need to find room in business decisions for subjectivity, intuition and judgement – things more generally associated with creative endeavours. You don’t, as he puts it, “go into the Museum of Fine Arts and say ‘I saw 800 square feet of paintings today’.”
Creatively effective
In fact, we don’t define ourselves as a creative business, but a creatively effective business. As the iconic David Ogilvy (a real Mad Man), espoused, “If it doesn’t sell, it’s not creative.”
The measurable effectiveness of a campaign (in whatever form that takes, from increased sales, protected profit margins and improved brand recognition to charity funds raised and better health outcomes) is the ultimate proof of worth for marketing communications.
In last year’s Annual General Meeting statement we said: “There are still businesses that see creativity as little more than a cosmetic: a final touch of lipstick to make a product look more appealing. They are profoundly wrong: and the world is full of case studies to prove them wrong. Applied creativity can be as central, as integral and as functional as any operating system; and should be expected to be so… This is creativity with a clear commercial purpose: if it fails in that purpose, however beautiful it may seem, it will have failed.”
While we are very proud to have won four consecutive awards for most creative holding company at the Cannes International Festival of Creativity, we are equally – if not more – pleased to have won four consecutive Effies for being the most effective group, too.
In other words, where great creativity leads, effectiveness (success for clients) follows.
Back to the future
Like the 12 months before it, 2015 will be tough going, but we expect a satisfactory outcome to the year. The pearls we make continue to be in demand.
Looking further ahead, corporate minds will eventually turn from retrenchment to investment and growth, and marketing services will be one of the principal beneficiaries. Moreover, we have the right strategy to take advantage of the fundamental shifts – both technological and geographical – shaping our industry.
Throughout our three decades of existence, taking the long view has worked well for WPP and its stakeholders. We continue to be guided by that philosophy.
10 key trends
1. Power is shifting South, East and South-East
New York is still the centre of the world, but power (economic, political and social) is becoming more widely distributed, marching South, East and South-East: to Latin America, India, China, Russia, Africa & Middle East and Central & Eastern Europe. Although growth rates in these markets have slowed, the underlying trends persist as economic development lifts millions into lives of greater prosperity, aspiration and consumption.
BrandZ™ Top 10 most valuable Latin American brands 2014
| Rank |
Brand |
Category |
Brand value 2014 $m |
Year-on-year change |
|
Source: BrandZ/Millward Brown Vermeer
|
| 1 |
Corona |
Beer |
8,025 |
21% |
| 2 |
Skol |
Beer |
7,055 |
8% |
| 3 |
Falabella |
Retail |
6,084 |
8% |
| 4 |
Telcel |
Communications providers |
5,308 |
-19% |
| 5 |
Bradesco |
Financial institutions |
4,177 |
-24% |
| 6 |
Sodimac |
Retail |
4,107 |
16% |
| 7 |
Televisa |
Communications providers |
3,625 |
11% |
| 8 |
Brahma |
Beer |
3,585 |
-6% |
| 9 |
Aguila |
Beer |
3,585 |
-9% |
| 10 |
Modelo |
Beer |
3,477 |
51% |
BrandZ™ Top 10 most valuable Indian brands 2014
| Rank |
Brand |
Category |
Brand value 2014 $m |
|
Source: BrandZ/Millward Brown Vermeer
|
| 1 |
HDFC Bank |
Banks |
9,425 |
| 2 |
Airtel |
Telecoms |
8,217 |
| 3 |
State Bank of India |
Banks |
6,828 |
| 4 |
ICICI Bank |
Banks |
3,034 |
| 5 |
Bajaj Auto |
Automobiles |
3,034 |
| 6 |
Asian Paints |
Paints |
2,812 |
| 7 |
Hero |
Automobiles |
2,164 |
| 8 |
Idea |
Telecoms |
1,882 |
| 9 |
Kotak Mahindra Bank |
Banks |
1,721 |
| 10 |
Reliance Communications |
Telecoms |
1,636 |
BrandZ™ Top 10 most valuable Chinese brands 2015
| Rank |
Brand |
Category |
Brand value 2015 $m |
Year-on-year change |
|
Source: BrandZ/Millward Brown Vermeer
|
| 1 |
Tencent |
Technology |
66,077 |
95% |
| 2 |
Alibaba |
Retail |
59,684 |
|
| 3 |
China Mobile |
Telecoms |
55,927 |
-9% |
| 4 |
ICBC |
Banks |
34,521 |
-13% |
| 5 |
Baidu |
Technology |
30,897 |
55% |
| 6 |
China Construction Bank |
Banks |
21,005 |
-18% |
| 7 |
Sinopec |
Oil & gas |
15,493 |
18% |
| 8 |
Agricultural Bank of China |
Banks |
15,427 |
-20% |
| 9 |
PetroChina |
Oil & gas |
12,022 |
-11% |
| 10 |
Bank of China |
Banks |
11,861 |
-13% |
Global GDP 1820-2013
USA vs Europe vs China vs India vs Latin America %
- USA
- Europe
- China
- India
- Latin America
2. Supply exceeds demand – except in talent
Despite the global financial crisis, manufacturing production still generally outstrips consumer demand. This is good news for marketing companies, because manufacturers require to invest in branding in order to differentiate their products from the competition.
Meanwhile, the war for talent, particularly in traditional Western companies, has only just begun. The squeeze is coming from two directions: declining birth rates and smaller family sizes; and the relentless rise of the web and associated digital technologies. Simply, there will be fewer entrants to the jobs market and, when they do enter it, young people expect to work for tech-focused, more networked, less bureaucratic companies. It is hard to recruit the right talent now; it will be harder in 20 years.
3. Disintermediation
An ugly word, with even uglier consequences for those who fail to manage it. It’s the name of the game for web giants like Apple, Google, Amazon and Alibaba, which have removed large chunks of the supply chain (think music retailers, business directories and bookshops) in order to deliver goods and services to consumers more simply and at lower cost.
Take our ‘frienemy’ Google: our biggest media trading partner at almost $3 billion out of over $70 billion of billings in 2014 and, at the same time, one of our main rivals, too. Xaxis and AppNexus face off against Google and DoubleClick. It’s a formidable competitor that has grown very big indeed by – some say – eating everyone else’s lunch, but marketing services businesses have a crucial advantage.
Google (like Facebook, Twitter, LinkedIn and others) is not a neutral intermediary, but a media owner. It sells its own platform. We, however, are independent, meaning we can give disinterested, platform-agnostic advice to clients. You wouldn’t hand your media plan to News Corporation or Viacom and let them tell you where to spend your advertising dollars and pounds, so why hand it to Google, Facebook and co?
4. Changing dynamics in retail
For the last 20 years or so the big retailers like Walmart, Tesco and Carrefour have had a lot more power than manufacturers, because they deal directly with consumers at the point of sale and who are accustomed to visiting their often big box stores. This won’t change overnight, but manufacturers can now have direct relationships with consumers via the web and e-commerce platforms in particular, at the same time as city dwellers (already 50% of the population, soon to be 70%), demand proximity retailing – smaller, more convenient stores. However, unless manufacturers move quickly, there is a danger that Amazon or Alibaba or Flipkart will become the new Walmart or Tesco.
5. Internal communications has grown up
Once an unloved adjunct to the HR department, internal communications has moved up the food chain and enlightened leaders now see it as critical to business success. One of the biggest challenges facing any chairman or CEO is how to communicate strategic and structural change within their own organisations. The prestige has traditionally been attached to external communications, but aligning internal constituencies is at least as important, and arguably more than half of our business.
6. Global and local up, regional down
The way our clients structure and organise their businesses is changing. Globalisation continues apace, making the need for a strong corporate centre even more important. Increasingly, though, what CEOs want is a nimble, much more networked centre, with direct connections to local markets – how can the centre know what is really going on in more than 100 or 200 countries? This also hands greater responsibility and accountability to local managers, and puts pressure on regional management layers that act as a buffer, preventing information from flowing upwards or downwards and stopping things from happening.
The world’s 20 largest companies*
| Rank |
Company |
Market cap $m |
Country |
|
Source: Corporateinformation.com
* Market values as at 2 April 2015.
|
| 1 |
Apple Inc. |
$718,106 |
US |
| 2 |
Google Inc. |
$379,481 |
US |
| 3 |
Berkshire Hathaway Inc. |
$356,523 |
US |
| 4 |
Exxon Mobil Corporation |
$350,592 |
US |
| 5 |
PetroChina Co Ltd |
$344,837 |
China |
| 6 |
Microsoft Corporation |
$336,691 |
US |
| 7 |
Johnson & Johnson |
$279,001 |
US |
| 8 |
Wells Fargo & Company |
$278,479 |
US |
| 9 |
Industrial And Commercial Bank Of China Ltd |
$266,389 |
China |
| 10 |
China Mobile Limited |
$263,887 |
Hong Kong |
| 11 |
Wal-Mart Stores, Inc. |
$262,516 |
US |
| 12 |
General Electric Company |
$250,278 |
US |
| 13 |
Nestlé S.A. |
$241,766 |
Switzerland |
| 14 |
China Construction Bank Corp |
$241,273 |
China |
| 15 |
Novartis AG |
$240,864 |
Switzerland |
| 16 |
Roche Holding Aktiengesellschaft |
$233,457 |
Switzerland |
| 17 |
Facebook Incorporation |
$233,158 |
US |
| 18 |
Toyota Motor Corporation |
$224,092 |
Japan |
| 19 |
Procter & Gamble Co |
$222,279 |
US |
| 20 |
JPMorgan Chase & Co. |
$221,216 |
US |
7. Number-crunchers have too much clout
Some companies seem to think they can cost-cut their way to growth. This misconception is a post-Lehman phenomenon: corporates still bear the mental scars of the crash, and conservatism rules. But there’s hope: the accountants will only hold sway over the chief marketing officers in the short term. There’s a limit to how much you can cut, but top-line growth (driven by investment in marketing) is infinite, at least until you reach 100% market share.
8. Bigger government
Governments are becoming ever more important – as regulators, investors and clients. Following the global financial crisis and ensuing recession, governments have had to step in and assert themselves – just as they did during and after the Great Depression in the 1930s and 1940s. And they are not going to retreat any time soon.
Administrations need to communicate public policy to citizens, drive health initiatives, recruit people, promote their countries abroad, encourage tourism and foreign investment, and build their digital government capabilities. All of which require the services of our industry.
9. Sustainability is no longer ‘soft’
The days when companies regarded sustainability as a bit of window-dressing (or, worse, a profit-sapping distraction) are long gone. Today’s business leaders understand that social responsibility goes hand-in-hand with sustained growth and profitability. Doing good is good business. Business needs permission from society to operate, and virtually every CEO recognises that you ignore stakeholders at your peril – if you’re trying to build brands for the long term.
10. Merger flops won’t put others off
Despite the failure of one or two recent high-profile mega-mergers, particularly the so-called mergers of equals, we expect consolidation to continue – among clients, media owners and marketing services agencies. Bigger companies will have the advantages of scale, technology and investment, while those that remain small will have flexibility and a more entrepreneurial spirit on their side.
FMCG and pharmaceuticals (driven by companies like 3G and Valeant) are where we anticipate the greatest consolidation. The acquisition of Kraft by Heinz, facilitated by 3G and Warren Buffet, has already sent shivers around the packaged-goods industry. Where will the juggernaut strike next? Our own industry is also likely to see some activity – with IPG and Havas the subject of constant takeover or consolidation rumours. Havas, unusually, is already effectively consolidated with a media owner. Bolloré Investissement controls both Vivendi, a media owner of Canal Plus, and Havas, a media buyer and planner. At WPP, we’ll continue to play our part by focusing on small- and medium-sized strategic acquisitions and investments (65 of them in all in 2014).
Number of M&A deals in marketing services sector 2014

Pharma industry consolidation 1980-2014
|
Source: Ogilvy CommonHealth Worldwide
|
| Merck |
Hoffman |
Hoechst Roussel |
Squibb |
Sandoz |
Glaxo |
Pfizer |
1980 |
| Schering-Plough |
Roche |
Marion |
Meyers |
Geigy |
Wellcome |
Parke-Davis |
|
| Organon |
Genentech |
Merrill Dow |
Bristol |
Ciba |
French |
Warner Lambert |
| |
|
RhonePoulenc |
DuPont Pharma |
|
Kline |
Monsanto |
| |
|
Sanofi |
|
|
Smith |
Upjohn |
| |
|
Synthelabo |
|
|
Beecham PLC |
Pharmacia |
| |
|
|
|
|
|
A.H. Robbins |
| |
|
|
|
|
|
Amer. Cyanamid |
| |
|
|
|
|
|
AHP |
 34 companies
 |
| |
La Roche Syntex |
Hoechst |
Squibb |
Sandoz |
French |
Pfizer |
| |
Genentech |
Sanofi-Synthelabo |
Bristol-Meyers |
Ciba-Geigy |
Beecham PLC |
Warner Lambert |
| |
|
RhonePoulenc & Fissons |
DuPont Pharma |
|
SmithKline |
Monsanto |
| |
|
Marion Merrill Dow |
|
|
|
Pharma Upjohn |
| |
|
|
|
|
|
Amer. Cyanamid |
| |
|
|
|
|
|
AHP |
| |
|
Hoechst |
BMS |
|
Beecham PLC |
Pfizer |
| |
|
RhonePoulenc & Fissons |
|
|
GlaxoWellcome |
Pharmacia |
| |
|
Sanofi-Synthelabo |
|
|
SmithKlineFrench |
AHP (Wyeth) |
| Merck |
Hoffman LaRoche |
Aventis |
|
|
GlaxoWellcome |
Wyeth |
| Schering-Plough |
Genentech |
Sanofi-Synthelabo |
|
|
SmithKlineBeecham |
Pfizer |
| Merck |
Roche |
Sanofi |
BMS |
Novartis |
GSK |
Pfizer |
| 7 companies |
2014 |