What is the issue?
Many clients are prioritising sustainability, seeking to reduce their impact on the environment and to communicate with consumers and stakeholders on these issues. Implementing our own environmental strategy enhances our credibility with clients and enables us to meet the environmental requirements included in a growing number of client procurement processes.
Our environmental program forms part of our wider efforts to improve operational efficiency and reduce costs to the business.
How we manage
Our environmental strategy is set at Group level and implemented by our regional Environmental Action Teams (EATs), in partnership with our companies. Our EATs include members of key Group functions, such as IT, real estate and procurement. Progress is regularly reviewed by our Group finance director who is responsible for WPP’s sustainability initiatives.
Our companies implement environmental management systems, of which a small percentage are certified to standards such as ISO 14001. We participate in the CDP Climate Change program, a collaboration of institutional investors, and were ranked in the B band for performance and received a disclosure score of 98 out of 100 (2013: 95B). WPP was included in the CDP Climate Disclosure Leadership Index 2014. We also take part, as a responding company, in the CDP Supply Chain program. Our carbon data is externally verified.
To support our operating companies to reduce emissions, we issue performance reports and scorecards to over 200 senior decision-makers each year in our businesses. This enables them to compare performance between WPP companies and to identify and prioritise lower-performing offices. Our Group teams conducted in-depth performance reviews with financial controllers from operating companies representing 80% of emissions in 2014. We hold regular workshops with facilities managers to help them use energy and carbon data to reduce their footprint. We also have an environmental toolkit for our companies that summarises WPP policies and provides case studies and information on best practices and key contacts within WPP.
Our carbon strategy
1.8
tonnes of CO2e per employee – our 2020 reduction target
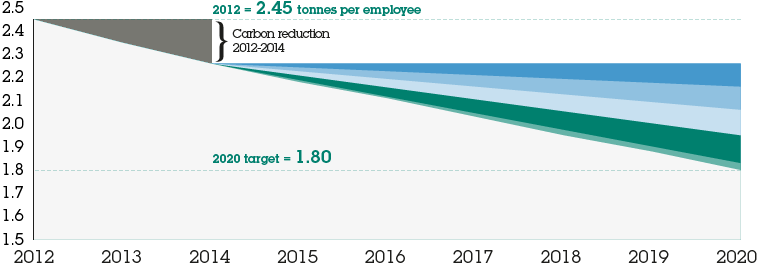
Our most significant greenhouse gas emissions come from energy use in our offices and business air travel. By 2020, we aim to reduce these emissions to 1.8 tonnes of CO2e per employee, a 47% reduction from our 2006 baseline.
Our strategy focuses on:
- Office energy use: Improving the energy efficiency of our buildings and IT systems. We estimate that 13% of our total floor space is now certified to advanced green building standards.
- Air travel: Reducing non-essential flights by promoting videoconferencing and offsetting 100% of carbon emissions from our business air travel. Our videoconferencing network now incorporates over 700 units in 160 cities.
- Renewable energy: Purchasing renewable electricity for our offices where available. Around 13% of the total electricity we purchase is generated from renewable sources.
We have identified the savings we need to achieve to reach our target by 2020 across all the priority areas of our strategy:
Carbon strategy 2012-2020
tonnes of CO2e per employee
Carbon strategy 2012-2020, tonnes of CO2e per employee
| |
|
Tonnes per employee |
% |
| |
2012 carbon intensity |
2.45 |
|
| |
Building energy efficiency |
-0.10 |
-21% |
| |
Investing in technology at new and existing buildings |
| |
Office space consolidation |
-0.10 |
-22% |
| |
Reducing space requirements in key cities |
| |
IT consolidation |
-0.11 |
-23% |
| |
Moving servers to best-in-class data centres |
| |
Renewable electricity |
-0.12 |
-26% |
| |
Increasing supply from 16% to 25% of total electricity use |
| |
Other reductions |
-0.03 |
-7% |
| |
From additional carbon reduction measures to be identified |
| |
2020 carbon intensity target |
1.80 |
-100% |
Performance in 2014
In 2014, our carbon footprint per employee was 2.26 tonnes, down 4% on 2013 and 33% lower than 2006. We target an annual 4% reduction in emissions and achieved this in 2014.
2.26
tonnes of CO2e emitted per employee in 2014 (2013: 2.35)
We use a carbon intensity target per employee, as headcount is closely linked to levels of business activity and allows us to reflect the impact of acquisitions and disposals without needing to adjust our baseline. We also measure carbon intensity against revenue, which shows a decrease of 5% on 2013 and 47% since 2006.
Carbon footprint in 2014
%
- Stationary fuel combustion 3
- Purchased electricity 49
- Business air travel 35
- Other estimated impacts 13
Carbon intensity 2006-2014
tonnes of CO2e

- Headcount intensity
- Target headcount intensity
- Revenue intensity
Our absolute carbon footprint in 2014 was 279,371 tonnes of CO2e (rating renewable electricity as zero emissions), a small drop of 0.2% over 2013 despite a 4% growth in headcount. If the renewable electricity we purchase globally is rated using the same emissions factors as standard grid electricity, our total carbon footprint in 2014 was 298,131 tonnes of CO2e.
279,371
tonnes of CO2e emitted in 2014 (2013: 279,859)
Our total energy consumption increased by 21% between 2006 and 2014. However, our energy use per employee decreased by 22%, largely due to investments in energy efficiency. As a result the Group avoided over £4.7 million in annual utility costs and 72,000 tonnes of CO2e. Similarly, since 2006, out total air miles have increased by almost 35%, but air miles per employee decreased by 14% and, as a result of our activities, we have avoided over 88 million air miles and 31,000 tCO2e emissions.
Decoupling emissions
We have had some success at decoupling carbon emissions from business growth. Since 2006, our absolute carbon footprint has increased by 4%, compared to a growth in reported headcount of 56% and revenue growth of 95%.
Decoupling emissions from business growth
index (2006 = 100)

- Revenue
- Headcount
- Emissions
Paul Richardson
Group finance director, WPP
“Climate change is a risk for all businesses. By cutting our own footprint and helping clients to engage citizens and consumers on climate change we can support efforts to reduce global carbon emissions while cutting our costs and improving long-term business resilience.
We achieved our annual 4% reduction target for emissions per employee this year, showing we are making progress towards our goals”
Building energy use
Our strategy for reducing the carbon footprint of our buildings varies according to building size.
When we lease, purchase, fit out or renovate a building larger than 50,000 square feet, we require it to be certified to an internationally-recognised green building standard, such as the US standard LEED (Leadership in Energy and Environmental Design) or the UK standard BREEAM (Building Research Establishment Environmental Assessment Method).
We estimate that 13% of our total floor space is now certified to recognised standards (over 3 million square feet), compared with 10% in 2013. Recent office moves to more energy-efficient locations have had an impact on our footprint, reducing energy use by an average of 21% at each location.
For offices below 50,000 square feet, which have not been certified to recognised green building standards, we have developed our own scorecard to assess the environmental performance of the building. The scorecard covers five criteria: energy and carbon; water; materials and waste; travel; and health & safety.
Detailed energy-use data can help us improve efficiency and reduce energy use. When acquiring or retrofitting buildings, access to energy data is one of the factors considered. We aim to integrate this into lease agreements with landlords and/or to install sub-metering. We operate metering at several key locations.
We aim to use office space more efficiently and to encourage flexible working where possible. This enables us to minimise the amount of space we need overall, and to reduce costs and carbon emissions.
Brewhouse Yard, London, UK
Brewhouse Yard is now home to the London offices of Brand Union, Sudler & Hennessey and Lambie-Nairn. This 40,000 square feet building in Clerkenwell, central London, has a BREEAM Very Good Rating for environmental performance, and over 80% of waste from the fit out was diverted from landfill. The building has been designed to foster collaboration, with a mix of closed and open meeting facilities as well as an amphitheatre and staircase that open up the centre of the building, bringing in natural light.
The space was designed by BDG architecture + design, a WPP company, and won the 2015 BCO Award for best fit out in London and the South East.
IT energy use
As part of a major IT Transformation program to improve the efficiency of our IT infrastructure across WPP companies, we have signed a partnership with IBM. This will accelerate the move of our IT infrastructure into best-in-class external data centre services by the end of 2016. The contract was signed in September 2014 and includes energy and environmental targets to ensure we realise the potential carbon reduction opportunities from improving IT efficiency.
Our managed print program will cut energy, paper and cartridges used by up to 30%. We have extended the scope of this program and aim to have 80% of our global printing fleet under management by the end of 2016.
Renewable energy
We aim to increase our use of renewable energy, including green-tariff electricity contracts, to 25% of total supply by 2020. We saw a drop to 13% in 2014, from 15% the previous year.
We are undertaking a program of operating company engagement during 2015 to address this. This will include a review of our top 100 electricity-consuming locations, identifying barriers to the use of renewable energy and working with our companies to increase take-up of green-tariff contracts where available.
Our use of renewable electricity reduces our carbon footprint by 18,760 tonnes of CO2e.
Total green-tariff electricity purchased
% breakdown
by country 2014
- UK 49
- US 19
- Germany 14
- Italy 7
- Other 11
Top 10 buyers of green-tariff electricity
as % of total electricity purchased
in each country 2014

Air travel
A service industry like ours relies on the close relationships we build with our clients. Direct personal contact is essential, and this often means air travel.
Videoconferencing
Although we cannot eliminate air travel, we can reduce non-essential flights and we encourage our teams to use videoconferencing where possible. Our videoconferencing network now incorporates over 700 units in 160 cities worldwide. During 2014, 79 new units were installed and use increased by over 52% from 2013. The long-term aim is to integrate this service into other platforms, enabling us to extend video services to all users within the Group. We have a 24-hour, five-day-a-week helpdesk to support the increased number of people and teams using these services.
Worldwide videoconferencing network
Key cities
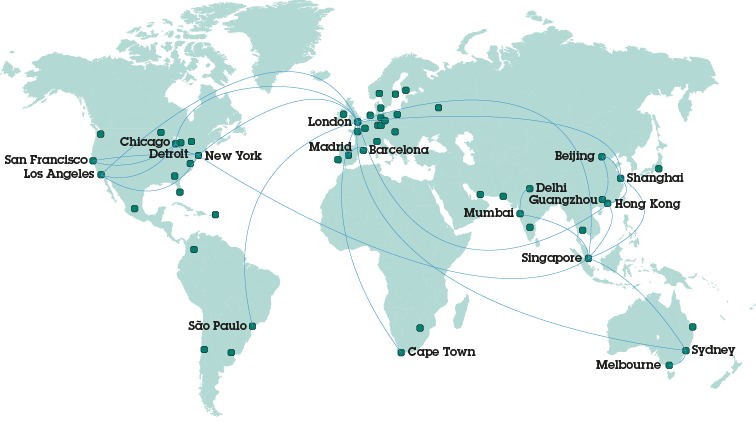
- VC units supported by WPP’s videoconferencing program
- Major air routes
96,577
carbon credits bought, offsetting 100% of carbon emissions from air travel in 2014
Offsetting our air travel emissions
We offset 100% of our unavoidable air travel emissions by purchasing high-quality carbon credits. We work with South Pole Group, a global company that develops emission-reduction projects. We invested £150,000 in 2014 to support four renewable energy-generation projects in faster-developing economies. We select projects that support socio-economic development in local communities, alongside environmental benefits. Our current portfolio of projects is summarised opposite. The cost of the carbon credits is charged to our operating companies, based on their air mileage. This provides an incentive to them to keep air travel down. Since 2007, we have purchased and permanently retired over 1 million carbon credits and, through them, supported 15 projects.
Carbon offsetting projects 2014
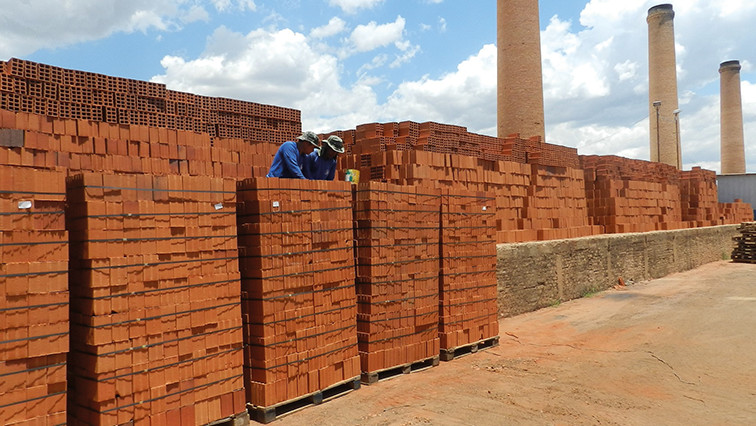
Brazil
Renewable biomass
Ituiutaba
10,000
tonnes of CO2e offset
Project
Ceramic factory running on thermal energy from agricultural waste instead of native forest timber in south-eastern Brazil
Standards
Verified Carbon Standard (VCS)
Social Carbon
WPP coverage
91% of annual credit issuance
Benefits
40 workers with improved working conditions
1,100 students involved in environmental activities
20,500 cubic metres of native forest timber saved per year (over 10,000 trees)
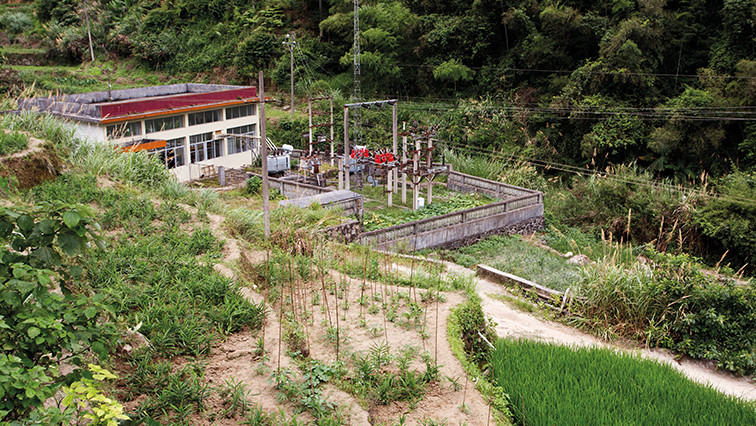
China
Small hydropower
Hezhou III
7,000
tonnes of CO2e offset
Project
Three small run-of-river hydropower plants in southern China generating 6m kWh of renewable electricity annually
Standards
Gold Standard
WPP coverage
100% of annual credit issuance
Benefits
30 direct jobs created
Decrease in open fireplaces in households (switch from burning wood for energy to hydroelectricity)
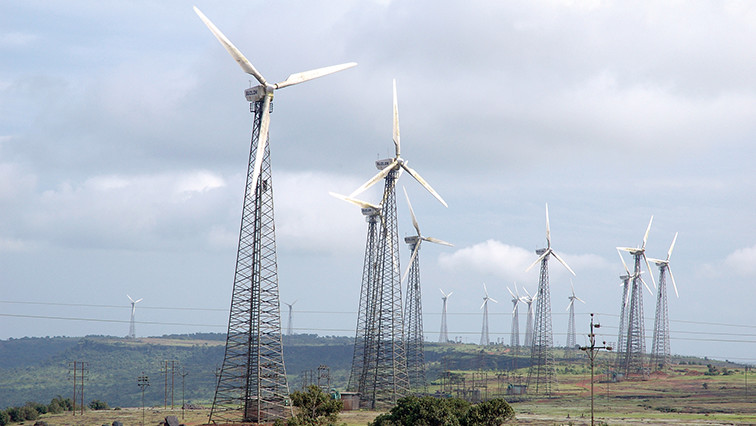
India
Wind power
Mitcon
60,000
tonnes of CO2e offset
Project
111 wind turbines across five regions in western India generating 143m kWh of renewable electricity annually
Standards
Verified Carbon Standard (VCS)
WPP coverage
50% of annual credit issuance
Benefits
450 direct jobs created
9,700 indirect jobs created
4,200 students with improved educational facilities
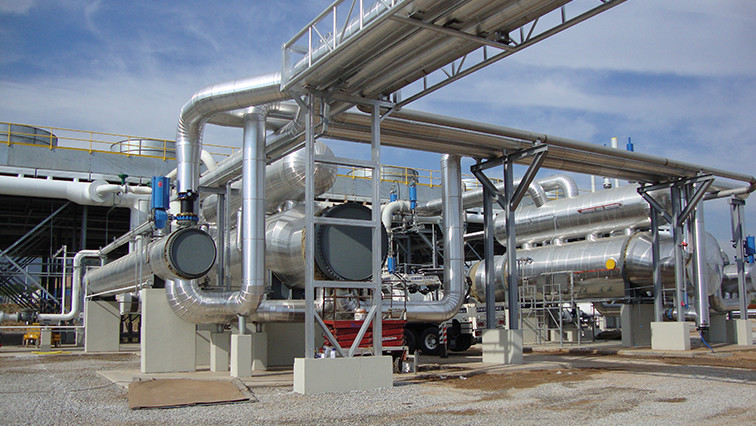
Turkey
Geothermal power
Dora II
19,577
tonnes of CO2e offset
Project
Geothermal plant in western Turkey generating 70m kWh of renewable electricity annually
Standards
Gold Standard
WPP coverage
43% of annual credit issuance
Benefits
117 direct jobs created
732 students with improved educational facilities
About carbon offsetting standards:
Gold Standard – Established in 2003 and endorsed by over 80 NGOs, the Gold Standard is used in both voluntary and CDM (Clean Development Mechanism) projects. The standard’s main purpose is to ensure that projects are both reducing emissions and providing sustainable benefits to local populations.
Social Carbon – Created in 2008 by the Ecologica Institute in Brazil, the Social Carbon Standard assesses the social, environmental and economic performance of projects. It works in conjunction with other carbon accounting standards, such as the Verified Carbon Standard, which measure emissions reductions.
Verified Carbon Standard (VCS) – Launched in 2006, the VCS is the most widely used carbon accounting standard for the voluntary carbon offsetting market. It ensures that emissions reductions meet accepted quality standards and are independently verified, uniquely numbered and transparently listed in a central database.
Scope 3: Understanding our wider carbon impact
We’ve been measuring our operational carbon emissions (from energy use and air travel) since 2006. However, we know that emissions in our supply chain exceed those in our own operations.
1.2m
tonnes of CO2e – estimated carbon emissions across our UK value chain
Although the majority of these emissions are not within our direct control, they are a result of the decisions WPP and its partners make – particularly in the areas of advertising production and media investment management.
Measuring these emissions will enable us to give clients the information they need to understand their own value chain emissions and provide an opportunity to work with clients and suppliers to reduce emissions connected with client media plans and other parts of our supply chain. With a growing number of clients prioritising the issue of climate change and working to cut their footprint, we believe the opportunity for developing low-carbon media campaigns is compelling.
The results of our analysis
We undertook our first detailed analysis of scope 3, or value chain emissions, during 2014. We worked with Arup, the engineering and professional services firm, to do this research. We looked at carbon emissions in our value chain including:
Carbon emissions across our UK value chain
Advertisements we place for clients account for the majority of our total carbon emissions of 1.2m tonnes of CO2e.
Our day-to-day activities and the goods and services we buy account for less than 20% of total emissions.
Our analysis is based on 2013 data and focuses on the UK, WPP’s home country and second-largest market.
- Advertisements we place for clients: emissions associated with the physical dissemination of advertising placed by GroupM, our Media Investment Management business, on behalf of clients through a variety of media channels. For example, emissions associated with energy used by the servers that host online advertising.
- Goods and services we buy: emissions associated with the goods and services we buy to create marketing campaigns for clients and to run our business. For example, emissions from energy used during a film shoot.
- Day-to-day activities: emissions associated with running our business. This includes office energy use and business air travel, as well as employee commuting and other activities such as waste from our operations.
Our analysis showed that, across our value chain, the advertisements we place for clients account for the most significant portion (81%) of our carbon footprint of 1.2 million tonnes of CO2e (see charts below).
81%
of our carbon emissions come from the advertisements we place for clients
In 2015, we will work with our procurement teams to understand how we can integrate the results of this analysis into our internal purchasing tools. We will also engage with our media planners at GroupM and key clients to start including carbon metrics in the media plans we develop.
The carbon impact of the advertisements we place for clients
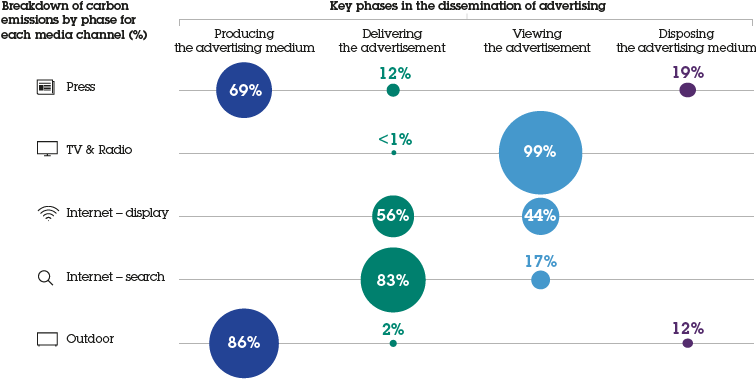
What we’ve included in our analysis:
- Emissions from the manufacturing and printing of paper
used for newspaper and billboards advertisements.
- Emissions from the energy used to transmit TV and radio ads,
to transfer advertisement data over the internet, and to deliver
newspaper and billboard advertisements.
- Emissions from the energy used to view and/or listen to
the advertisement on a TV/radio, smartphone, tablet or computer.
- Emissions from the disposal of newspaper and billboard
advertisements.
WPP’s carbon emissions statement 2014
This data covers the year ended 31 December 2014 in line with the Group’s financial reporting period.
CO2e emissions breakdown (in tonnes)
CO2e emissions breakdown (in tonnes)
|
Emission source
|
Base year
|
|
2014
|
2013
|
2012
|
2011
|
2006
|
|
Scope 1
|
Natural gas combustion
|
7,202
|
8,757
|
7,584
|
7,486
|
1,946
|
|
Heating oil combustion
|
2,545
|
2,548
|
2,256
|
2,228
|
682
|
|
Total scope 1 emissions
|
9,747
|
11,305
|
9,840
|
9,714
|
2,628
|
|
Scope 2
|
Total purchased electricity at grid average intensity (gross)
|
155,367
|
157,471
|
164,212
|
152,968
|
149,728
|
|
Less purchases of renewable electricity (see note 6)
|
(18,760)
|
(21,299)
|
(23,765)
|
(22,572)
|
–
|
|
Total scope 2 emissions (net)
|
136,607
|
136,172
|
140,447
|
130,396
|
149,728
|
|
Scope 3
|
Business air travel
|
96,577
|
95,879
|
96,079
|
100,960
|
81,714
|
|
Other estimated scope 3 emissions (see note 4)
|
36,440
|
36,503
|
36,955
|
36,161
|
35,111
|
|
Total scope 3 emissions
|
133,017
|
132,382
|
133,034
|
137,121
|
116,825
|
| |
Total CO2e emissions (net)
|
279,371
|
279,859
|
283,321
|
277,231
|
269,181
|
| |
Total CO2e emissions (gross)
|
298,131
|
301,158
|
307,086
|
299,803
|
269,181
|
Carbon intensity (in tonnes of CO2e)
Carbon intensity (in tonnes of CO2e)
|
Intensity metric
|
Base year
|
|
2014
|
2013
|
2012
|
2011
|
2006
|
|
Tonnes per employee (net)
|
2.26
|
2.35
|
2.45
|
2.44
|
3.39
|
|
Percentage change from 2006
|
(33%)
|
(31%)
|
(28%)
|
(28%)
|
–
|
|
Tonnes per £m of revenue (net)
|
24.23
|
25.40
|
27.31
|
27.66
|
45.56
|
|
Percentage change from 2006
|
(47%)
|
(44%)
|
(40%)
|
(39%)
|
–
|
Office energy use (in megawatt hours)
Office energy use (in megawatt hours)
|
Energy type
|
Base year
|
|
2014
|
2013
|
2012
|
2011
|
2006
|
|
Direct energy use (natural gas and heating oil)
|
44,841
|
52,532
|
45,673
|
45,090
|
12,099
|
|
Indirect energy use (purchased electricity)
|
326,513
|
328,374
|
323,582
|
307,245
|
295,396
|
|
Total energy use
|
371,354
|
380,906
|
369,255
|
352,335
|
307,495
|
|
% of electricity from renewable sources
|
13%
|
15%
|
16%
|
16%
|
–
|
Notes to WPP’s carbon emissions statement 2014
1. Reporting standard
Our carbon emissions statement 2014 has been prepared in accordance with the World Resource Institute (WRI) and World Business Council for Sustainable Development (WBCSD) Greenhouse Gas Protocol: A Corporate Accounting and Reporting Standard, Revised Edition (the GHG Protocol).
2. Greenhouse gases
All greenhouse gases emissions figures are in metric tonnes of carbon dioxide equivalents (CO2e). They include three of the six greenhouse gases covered by the Kyoto Protocol – carbon dioxide (CO2), methane (CH4) and nitrous oxide (N2O). Perfluorocarbons (PFCs), hydrofluorocarbons (HFCs) and sulphur hexafluoride (SF6) emissions have been omitted from our reporting as they are not a material source of greenhouse gases for WPP.
3. Organisational boundary
Emissions data is included for all operations for which WPP and its subsidiaries have operational control. This covers 124,000 employees. Associate companies are excluded.
4. Operational boundary
We include the following emissions in our reporting:
- Direct emissions (scope 1):
- Fuel used to heat WPP premises (combustion of natural gas and heating oil).
- Indirect emissions (scope 2):
- All purchased electricity, including electricity purchased at grid average carbon intensity and renewable electricity purchased under specific green-tariff contracts.
- Other indirect emissions (scope 3):
- Employee business air travel.
- An estimate for other scope 3 emissions that we do not currently measure on a global basis, including emissions from leased cars, taxis and couriers. This estimate is an additional 15% that we add to our carbon footprint and is shown under ‘other estimated scope 3 emissions’.
5. Geographic scope
Our CO2e emissions data covers our worldwide operations.
6. Emission factors
CO2e emissions have been calculated on the basis of measured or estimated energy use, fuel use and miles travelled, multiplied by the relevant carbon emission factors. In 2014, we updated our emissions factors for scope 2 and scope 3 emissions, and our data is based on the following emissions factors:
Emission factors
|
Emission scope
|
Emission factors used
|
Scope 1
(fuel used to heat WPP premises)
|
IPCC 2006 Guidelines for National Greenhouse Gas Inventories (using global warming potentials from the 2007 IPCC Fourth Assessment Report).
|
Scope 2
(purchased electricity)
|
Location-based emission factors from, in order of preference, local (e.g. data from Puerto Rico Electric Power Authority), subnational (e.g. USA EPA eGrid 2014) and national sources (e.g. International Energy Agency, CO2 Emissions from Fuel Combustion, 2014 Edition).
|
Scope 3
(business air travel)
|
UK Department for Environment, Food & Rural Affairs (Defra), GHG Conversion Factors for Company Reporting (2014).
|
When calculating our carbon footprint, we rate purchased renewable electricity as zero emissions. For full transparency, we also disclose total electricity purchased at grid average carbon intensity.
7. Data collection methodology
Data used to calculate CO2e emissions is collected quarterly through WPP’s financial reporting system, and includes some estimated data (e.g. in some locations electricity usage is estimated based on headcount or floor space). In 2014, our data covered 99% of our operations by employee headcount. The remaining 1% was extrapolated based on the Group’s total headcount at year-end.
8. External assurance
Our carbon data is reviewed by Bureau Veritas, an independent assurance provider. Following its review of our 2013 data, Bureau Veritas made a number of recommendations for improving our approach. We have implemented many of these in our 2014 reporting process. This includes enhancements to our sustainability data collection system to facilitate the ease and accuracy of data submission for our companies. See the Independent Verification Statement.
Resource use and waste
We aim to use resources carefully and to reduce the amount of waste we generate and send to landfill. This is part of how we operate as an efficient business and is in line with the sustainability expectations of our clients.
To help improve our performance in this area, we encourage our operating companies to use preferred suppliers selected by WPP who offer more sustainable products and services.
Paper
Our target is to source 50% of the paper we use for copying and printing from recycled sources by 2015. In 2014, 28% of the paper purchased by WPP companies contained at least 50% post-consumer recycled fibre. Despite having established preferred suppliers of recycled paper in all major markets for our companies to use, we are not on track to meet our 2015 target.
A significant portion of the non-recycled paper we use is certified to recognised sustainability standards such as FSC or PEFC, which shows it has been sourced from responsibly-managed forests. We believe that certified paper is a sustainable alternative to recycled paper and we will be reviewing our target and approach in this area during 2015.
Our total paper usage in 2014 was 5,101 tonnes. Our managed print program (see IT energy use) helps us to reduce paper use by up to 30% per location.
Paper sourcing
%
- Paper purchased with recycled content 28
- Paper purchased without recycled content 72
Waste
Our key waste streams are electronic waste and office consumables such as paper, card, cans, plastic bottles and toner cartridges. We aim to increase recycling and reduce the amount of waste sent to landfill.
We have established preferred suppliers of recycling services for paper, standard office consumables and mobile phones in all major markets. In 2014, we recycled 5,416 tonnes of waste (an increase from 5,106 tonnes in 2013). Of our total recycled waste, 73% was paper and cardboard.
Our goal is for obsolete IT equipment to be refurbished and sold for reuse, or if this is not possible, to be broken down for recycling. Disposal is a last resort, and must be done in compliance with local environmental regulations and data security best practice (see information on privacy and data security). Disposal of our IT waste has been incorporated into the IBM IT Transformation contract to increase reuse and recycling and to dispose of old IT equipment safely.
Waste recycling
%
- Paper and cardboard 73
- IT equipment 3
- Other waste recycled 24
Water
We are not a major water user but our companies take steps to reduce water use in their offices; and we include water conservation in our property acquisition process (see Building energy use).
Reducing water use is particularly important for offices located in water-scarce areas. Since 2010, we have been running a water conservation pilot in our 11 largest locations in areas of water scarcity (which account for around one fifth of our floor space in these areas).
In 2014, water use at these locations was 11.6 cubic metres per employee, down 6% on 2013 and 21% lower than our 2010 baseline. We were targeting a 20% reduction in water use per employee by 2015 and achieved this one year early. This has been achieved by: identifying and repairing leaks; upgrading water fixtures and fittings during renovations; and reusing rainwater and wastewater where feasible.
Total water use was 70,546 cubic metres, a decrease of 4% over 2013.
Our companies are primarily based in urban areas and source their water from municipal water suppliers.
Offices in areas of
water scarcity %
- Little or no water scarcity 80
- Economic water scarcity 4
- Approaching physical
water scarcity 9
- Physical water scarcity 7
Water use at key locations in areas of water scarcity

- Water intensity (per employee)
- 2015 target