Dear share owner
2
016, our thirty-first year, was another record year, our sixth record year in a row, despite a generally low growth, or tepid, global environment. Top-line growth remained strong, with operating profits and margins meeting and exceeding targets and all regions and sectors showing growth on almost all metrics. For the sixth successive year, WPP was named Creative Holding Company of the Year at the Cannes International Festival of Creativity, in recognition of your Company’s collective creative excellence; for the fifth consecutive year, WPP was ranked Most Effective Holding Company in the Effie Global Effectiveness Index; and, for the third year in a row, WPP was named the World’s Top Holding Company by Warc.

Cannes International Festival of Creativity
Holding Company of the Year
2011, 2012, 2013, 2014, 2015, 2016

Effie Global Effectiveness Index
Most Effective Holding Company of the Year
2012, 2013, 2014, 2015, 2016
At the same time, we have responded to the changing competitive landscape by accelerating the implementation of our strategic goals, particularly following Brexit. Sector targets for fast-growth markets and new media have been raised from 35-40% to 40-45% over the next four to five years, with the quantitative revenue target of 50% already achieved.
Your share price increased by over 16% in 2016, closing at 1,816p at year end. Since then it has fallen slightly to 1,737.0p, down 4%, at the time of writing. This was primarily due to the Company's reduced revenue and net sales guidance for 2017 from 3% to 2% due to an increasingly challenging economic environment. Dividends increased by almost 27% to 56.60p, a new high. This represents a dividend payout ratio of 50% of headline diluted earnings per share, reaching the recently targeted payout ratio of 50% one year ahead of schedule and up from 47.7% last year.
Reported billings were £55.2 billion, up well over 5% in constant currencies, reflecting good overall performance in net new business. Revenue was up well over 17% to £14.4 billion and up over 7% in constant currencies. Net sales were up almost 18% and over 7% in constant currencies. Including 100% of associates and investments, revenue is estimated to total around £19 billion (over $26 billion). Headline PBIT was up almost 22% to £2.160 billion (over £2 billion for the first time) and up well over 8% in constant currencies. Net sales margins increased by 0.5 margin points to an industry-leading 17.4% and, on a like-for-like basis, were up 0.3 margin points, in line with target, adjusted for the merger with STW Communications Group Limited in Australia.
Reported profit before interest and tax rose almost 26% to £2.113 billion from £1.679 billion, up 12% in constant currencies. Headline EBITDA increased by almost 21% to £2.420 billion, up 8% in constant currencies. Headline profit before tax was up well over 22% to £1.986 billion and reported profit before tax was up almost 27% to £1.891 billion. Diluted headline earnings per share rose by almost 21% to 113.2p (an all-time high) and diluted reported earnings per share were up over 22% to 108.0p, both reflecting like-for-like revenue and net sales growth, margin improvement and the benefit of acquisitions, along with the effect of currency tailwinds.
Return on equity decreased marginally to 16.2% in 2016 compared with 16.3% in 2015, versus a weighted average cost of capital of 6.4% in 2016, also down from 6.7% in 2015. Additionally, the value of the Group’s non-controlled investments rose to £1.3 billion during the year, from £1.2 billion in 2015, chiefly reflecting the value of its content businesses, primarily VICE and Refinery29, and the Group’s investment in leading media measurement company comScore, which merged with Rentrak in the first half of 2016.
Free cash flow amounted to almost £1.6 billion in 2016. This free cash flow was absorbed by £0.7 billion of net cash acquisition payments and investments, £0.4 billion of share buy-backs and £0.6 billion of dividends, a total outflow of £1.7 billion. This resulted in a net cash outflow of £0.1 billion, before any changes in working capital. Average net debt was therefore £4.3 billion in 2016, compared to £4.0 billion in 2015, at 2016 exchange rates, and net debt at 31 December 2016 was £4.1 billion, against £3.2 billion at 31 December 2015, primarily reflecting the weakness of sterling. This trend has continued in the first two months of 2017, with average net debt of £4.2 billion against £3.8 billion for the same period in 2016, at 2017 exchange rates.
The average net debt to headline EBITDA ratio in 2016 remains under 1.8 times, which is almost in the middle of the Group’s target range of 1.5-2.0 times. Headline interest cover in 2016 was 12.4 times. Our long-term debt is currently rated Baa2 and BBB and our short-term debt P2 and A2, by Moody’s and Standard & Poor’s respectively.
In September 2016, the Group issued £400 million of 30-year bonds with a coupon of 2.875%. These bonds refinance £400 million of bonds maturing in April 2017 with a coupon of 6.0%. This continues the plan to extend debt maturities and take advantage of current low interest rates.
With the equity market capitalisation at the time of writing of approximately £22.2 billion, the total enterprise value of your Company is approximately £27.2 billion, a multiple of 11.3 times 2016 headline EBITDA.
Revenue growth impacted by strong currency tailwinds in the second half
Our reported revenue growth for the year was 17.6%, and on a constant currency basis, which excludes the impact of currency movements, revenue was up 7.2%. This difference of 10.4% reflects the weakness of the pound sterling against most currencies, particularly in the second half, following the UK vote to exit the European Union.
Our 5 ‘Billion Dollar Markets’
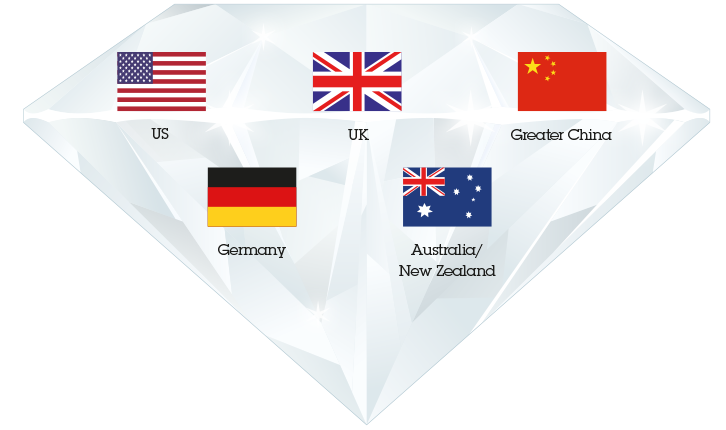
WPP companies (including associates and investments) generated revenues of more than $1 billion in five markets
On a like-for-like basis, which excludes the impact of currency and acquisitions, revenue was up 3.0%, with net sales up 3.1%. In the fourth quarter, like-for-like revenue was up 0.5%, the weakest quarter of the year, following like-for-like growth of well over 6% in the final quarter of 2015, which was that year’s strongest quarter. North America and the UK slowed in the fourth quarter, again partly the result of stronger comparatives, with Western Continental Europe and Asia Pacific, Latin America, Africa & the Middle East and Central & Eastern Europe continuing to perform well. Like-for-like net sales growth was stronger than revenue growth, over 2% in the fourth quarter, also against a strong comparative in 2015, with all regions, except the UK, showing growth.
Strong growth in many regions
North America constant currency revenue was down almost 1% in the final quarter and like-for-like down almost 3%, largely as a result of the particularly strong comparatives in the fourth quarter of 2015, when constant currency revenue grew over 11% and like-for-like revenue was up almost 10%, reflecting strong growth in Advertising and Media Investment Management, parts of the Group’s Public Relations & Public Affairs businesses and in the Branding & Identity, Healthcare Communications and direct, digital and interactive operations. On a full-year basis, constant currency revenue was up almost 4%, with like-for-like up 2%. However, constant currency net sales grew almost 3% in the fourth quarter, with like-for-like up 0.5% and strong growth in the Group’s Branding & Identity and direct, digital and interactive businesses.
UK constant currency revenue was down almost 1% in the final quarter and like-for-like down well over 2%, again in part due to very strong comparatives for the final quarter of 2015, which saw growth of well over 6% and almost 3% respectively. Media Investment Management and Data Investment Management like-for-like revenue was up strongly, offset by weaker performance in Advertising, Public Relations & Public Affairs and direct, digital and interactive. Despite the slight slow-down in the rate of revenue growth, constant currency net sales were up almost 2% in the final quarter, with like-for-like down 0.6%. On a full-year basis, constant currency revenue was up strongly at 5%, with like-for-like up almost 2%, with the second half weaker, perhaps reflecting Brexit uncertainties. Full-year net sales were up well over 5% in constant currency, with like-for-like up over 2%.
Western Continental Europe, continued to grow at reasonable and stronger than average rates, although reflecting difficult political and macroeconomic conditions, with like-for-like revenue growth of over 3% and net sales growth of almost 3% in the fourth quarter, compared to well over 5% and over 3% in the third quarter. For the year, Western Continental Europe revenue grew almost 5% on a like-for-like basis (over 4% in the second half), compared with almost 5% in 2015, with net sales growth of well over 3% like-for-like (almost 3% in the second half), compared to well over 2% in 2015. Germany, Norway, Spain, Sweden and Switzerland all showed good growth in the final quarter, but Austria, France, Ireland, Italy, the Netherlands and Portugal were tougher.
In Asia Pacific, Latin America, Africa & the Middle East and Central & Eastern Europe, on a constant currency basis, revenue growth in the fourth quarter remained strong at almost 12%, the same as the first nine months growth, with like-for-like up almost 4%, the strongest quarter of the year, and well ahead of the first nine months growth of over 3%. Growth in the fourth quarter was driven principally by Latin America, Central & Eastern Europe, the Next 11¹, CIVETS², and the MIST³, with Africa & the Middle East weaker. Constant currency net sales growth in the region was even stronger at almost 13% in the final quarter, with like-for-like net sales up almost 5%, the strongest quarter of the year, and well ahead of the almost 4% achieved in quarter two. There was strong net sales growth in all sub-regions except Africa & the Middle East. In Asia, Cambodia, India, Malaysia, Pakistan, the Philippines and Vietnam showed double-digit like-for-like growth, with Hong Kong, Singapore and Thailand, more challenging.
Latin America had its second strongest quarter of the year, with like-for-like revenue up almost 9%, compared with well over 9% in quarter two. Like-for-like net sales grew over 8% in quarter four, also the second highest quarterly growth in 2016, with full-year growth of well over 6% (well over 6% in the second half and similar in the first half). Africa slipped back in the fourth quarter, as it did in the third quarter, with like-for-like revenue down over 1% in quarter four and up 2% full-year. Net sales growth was slightly weaker, down 1.9% like-for-like in quarter four and up 0.4% full-year. In Central & Eastern Europe, like-for-like revenue was up over 10% in quarter four, the second highest quarter of the year, with the Czech Republic, Romania, Russia and the Ukraine up double digits. Croatia, Hungary, Poland and Serbia were tougher. Full-year revenue for the BRICs4, which account for almost $2.4 billion of revenue, was up almost 2% on a like-for-like basis, with the Next 11 and CIVETS up over 14% and well over 12% respectively. The MIST was up over 16%.
In 2016, 29.9% of the Group’s revenue came from Asia Pacific, Latin America, Africa & the Middle East and Central & Eastern Europe, up almost 1.0 percentage point from 29.0% in 2015. On a net sales basis there was a similar increase to 30.5% from 29.6% in 2015, which compares with the Group’s strategic objective of 40-45% in the next five years. Markets outside North America now account for over 63% of our revenue.
Constant currency1 revenue growth %

Constant currency1 net sales growth by geography %

Net sales margin by geography2 %

Revenue by geography £m
- North America
- UK
- Western Continental Europe
- Asia Pacific, Latin America, Africa & Middle East and Central & Eastern Europe
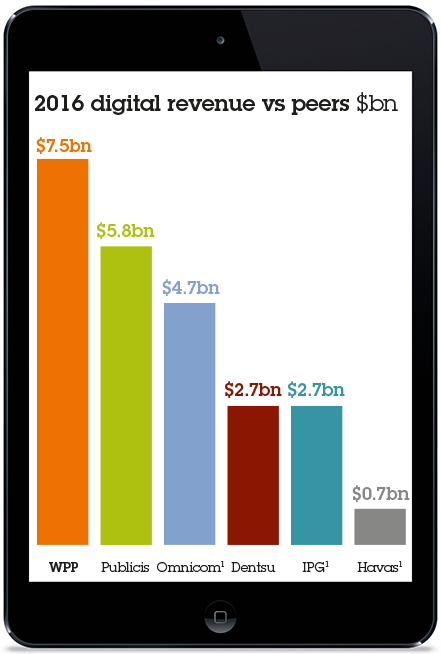
2016 revenue by geography versus peers $bn
- Rest of World5
- Western Europe (including UK)
- North America
Advertising and Media Investment Management was the second-strongest performing sector, with constant currency revenue growth of almost 8% for the year, and well over 4% in quarter four. On a like-for-like basis, Advertising and Media Investment Management was the strongest performing sector, with revenue up almost 5% for the year and up almost 1% in quarter four, reflecting the impact of a weaker net new business record. Advertising grew in Asia Pacific in quarter four and the full year, but softened in all other regions, as trading conditions became more difficult. Media Investment Management showed strong like-for-like revenue growth, up over 8% for the year, up just under 3% in quarter four, with strong growth in the UK, Continental Europe and Latin America.
Of the Group’s Advertising networks, Grey performed particularly well in 2016, especially in the US. As mentioned above, Asia Pacific was up, but elsewhere conditions were more challenging and overall Advertising remained under pressure. Growth in the Group’s Media Investment Management businesses has been very consistent for most of 2016, with constant currency and like-for-like revenue up strongly for the year, but with a weaker second half, largely the result of a more difficult final quarter, as weaker net new business in the US impacted overall performance. Elsewhere, like-for-like revenue growth in Western Continental Europe, Media Investment Management’s second largest region, was up 8%, with the UK and Latin America up double digits. tenthavenue, the ‘engagement’ network focused on out-of-home media, also performed strongly in the fourth quarter, with like-for-like net sales up well over 5%, with strong growth of well over 6% in the second half. The strong revenue and net sales growth across most of the Group’s businesses, offset by slower growth in the Group’s Advertising businesses in most regions, resulted in the combined reported operating margin of this sector up by 0.5 margin points to 19.0%, up 0.2 margin points in constant currency.
Our 9 ‘Billion Dollar Brands’
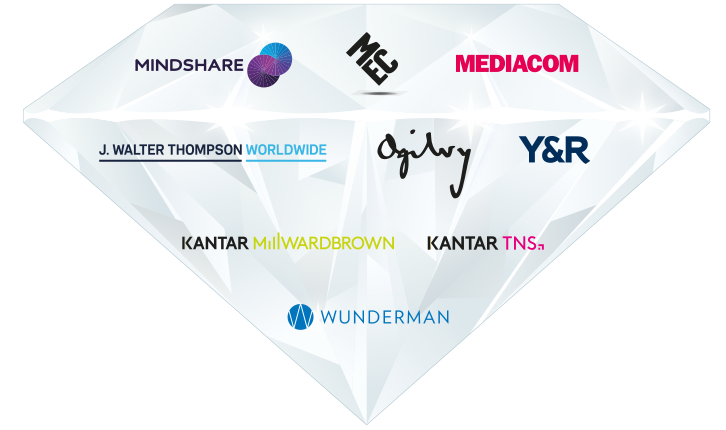
Nine WPP brands have generated revenues of $1 billion or more
In 2016, J. Walter Thompson Worldwide, Ogilvy, Y&R and Grey generated net new business billings of £1.1 billion ($1.7 billion). In the same year, GroupM (the Group’s Media Investment Management company, which includes Mindshare, MEC, MediaCom, Maxus, GroupM Search, Xaxis and now, Essence), together with tenthavenue, generated net new business billings of £2.4 billion ($3.7 billion). The Group totalled £4.4 billion ($6.8 billion), compared with £5.6 billion ($8.6 billion) in 2015.
Constant currency1 revenue growth by sector %

Constant currency1 net sales growth by sector %

Net sales margin2 by sector %

Revenue by sector £m
- Advertising and Media Investment Management
- Data Investment Management
- Public Relations & Public Affairs
- Branding & Identity, Healthcare and Specialist Communications
Data Investment Management revenue was down almost 2% on a like-for-like basis in the fourth quarter, but more importantly, net sales were up well over 1% on the same basis. On a full-year basis, constant currency revenue was up 0.4%, but down almost 1% like-for-like, with a weaker second half. Net sales, however, showed stronger growth with constant currency net sales up over 3%, up almost 1% like-for-like. The mature markets were more difficult, remaining under pressure, but the faster growth markets grew net sales 3%. Syndicated research continues to show resilience, with like-for-like net sales growth up well over 1%, but custom research, which accounts for almost half of Data Investment Management net sales, was down a similar amount. Kantar Worldpanel, Kantar Health, Kantar Public, Kantar Retail and Kantar IMRB all showed strong like-for-like net sales growth, with Kantar Insights more challenged. There seems to be a growing recognition of the value of ‘real’ first-party data businesses, rather than those that depend on third-party data. Reported operating margins improved 1.4 margin points to 17.6% and by 1.0 margin points in constant currency. Good cost control and the continued benefits of restructuring contributed to the improvement in operating margin. Although there has been further improvement during 2016, the slowest sub-sector continues to be like-for-like net sales growth in the custom businesses in mature markets, where discretionary spending remains under review by clients.
The Group’s Public Relations & Public Affairs businesses continued the growth shown earlier in the year, with a stronger second half, but slower fourth quarter, primarily the result of stronger comparatives in the specialist Public Relations businesses in the final quarter of 2015. Constant currency revenue grew well over 2% in quarter four with like-for-like net sales down almost 1%, with strong growth in Continental Europe and the Middle East & Africa, but North America was down over 2%, with the UK down significantly, as a result of lower M&A activity in the Group’s specialist financial Public Relations & Public Affairs businesses in the fourth quarter compared with 2015. Despite the slower growth in the final quarter, like-for-like net sales in the Group’s specialist Public Relations & Public Affairs businesses were up almost 7% for the year, and Cohn & Wolfe performed particularly well. Ogilvy and Hill+Knowlton Strategies also improved, with Burson-Marsteller less buoyant. An improving top-line and good control of costs resulted in the operating margin improving by 1.1 margin points to 16.7% and by 0.8 margin points in constant currency.
At the Group’s Branding & Identity, Healthcare and Specialist Communications businesses (including direct, digital and interactive), constant currency revenue grew strongly at 8% in quarter four, the strongest performing sector, with like-for-like revenue up well over 1%. The Group’s direct, digital and interactive businesses, especially WPP Digital, VML and Wunderman performed strongly, with parts of the Group’s remaining Branding & Identity, Healthcare and Specialist Communications businesses also growing strongly. Operating margins, for the sector as a whole, improved 0.2 margin points to 15.4% but fell 0.3 margin points in constant currency, with operating margins negatively affected as parts of the Group’s direct, digital and interactive businesses in Western Continental Europe, together with Branding & Identity and Healthcare Communications, slowed.
In 2016, 38.9% of the Group’s revenue came from direct, digital and interactive, up 1.4 percentage points from the previous year, with like-for-like revenue growth of almost 6% in 2016.
Margins reach new high
Net sales margin was up 0.5 margin points to a new historical high of 17.4%, up 0.2 margin points in constant currency, and up 0.3 margin points like-for-like, in line with the Group’s full-year margin target, adjusted for the merger with STW Communications Group Limited in Australia. The net sales margin of 17.4% is after charging £34 million ($49 million) of severance costs, compared with £24 million ($37 million) in 2015 and £367 million ($486 million) of incentive payments, versus £331 million ($505 million) in 2015.
Group revenue is more weighted to the second half of the year across all regions and sectors, and, particularly, in the faster-growing markets of Asia Pacific and Latin America. As a result, the Group’s profitability and margin continue to be skewed to the second half of the year, with the Group earning approximately one-third of its profits in the first half and two-thirds in the second half.
As outlined in previous years, due to the increasing scale of digital media purchases within the Group’s Media Investment Management businesses and of direct costs in Data Investment Management, net sales is the more meaningful and accurate reflection of top-line growth, although currently, only one of our competitors reports net sales.
Net sales are a more appropriate measure because Data Investment Management revenue includes pass-through costs, principally for data collection, on which no margin is charged. In addition, the Group’s Media Investment Management sub-sector is increasingly buying digital media for its own account on a transparent opt-in basis and, as a result, the subsequent billings to clients have to be accounted for as revenue, as well as billings.
Containment of operating costs continues
During 2016, the Group continued to manage operating costs effectively, with improvements across most cost categories, particularly staff and property costs.
Headline operating costs rose by 16.8%, rose by 7.0% in constant currency and by 2.7% like-for-like. On all bases, the growth in costs was lower than the growth in revenue and net sales.
On a like-for-like basis, the average number of people in the Group, excluding associates, in 2016 was 132,657 compared to 132,315 in 2015, an increase of 0.3%. On the same basis, the total number of people in the Group, excluding associates, at 31 December 2016 was 134,341 compared to 134,479 at 31 December 2015, a decrease of 138 or 0.1%. This reflected the transfer of a further 250 staff to IBM in the first half of 2016, as part of the strategic partnership agreement and IT transformation program, together with the continuing sound management of headcount and staff costs in 2016 to balance revenue and costs. On the same basis, revenue increased 3.0% and net sales 3.1%.
Reported staff costs, excluding incentives, increased by 17.3%, up 7.5% in constant currency. Incentive payments amounted to £367 million ($486 million), which were 14.9% of headline operating profit before incentives and income from associates, compared with £331 million ($505 million) or 16.2% in 2015. Achievement of target, at an individual company level, generally generates 15% of operating profit before bonus as an incentive pool, 20% at maximum and 25% at super maximum.
On a reported basis, operating margins, before all incentives and income from associates, were 19.9%, up 0.6 margin points, compared with 19.3% last year. The Group’s staff costs-to-net sales ratio, including severance and incentives, decreased by 0.4 margin points to 62.8% compared to 63.2% in 2015, indicating increased productivity.
As a result of all this, headline PBIT was up almost 22% to £2.160 billion, over £2 billion for the first time, from £1.774 billion and up well over 8% in constant currencies.
In 2016, the Group generated exceptional gains of £277 million, largely representing re-measurement gains in relation to the Group’s interest in Imagina and gains on the sale of the Group’s interest in Grass Roots. These were partly offset by investment write-downs of £86 million, resulting in a net gain of £191 million, which in accordance with prior practice, has been excluded from headline profit. The Group took a £27 million restructuring provision, primarily IT Transformation costs, resulting in a net exceptional gain of £164 million. After all these gains and restructuring costs, reported PBIT rose by almost 26% to £2.113 billion from £1.679 billion, up 12% in constant currencies.
Net finance costs (excluding the revaluation of financial instruments) were up 14.8% at £174.1 million, compared with £151.7 million in 2015, an increase of £22.4 million. This is due to the weakness in sterling resulting in higher translation costs on non-sterling debt, the cost of higher average net debt and lower income from investments, all partially offset by the beneficial impact of lower bond coupon costs resulting from refinancing maturing debt at cheaper rates.
The Group’s headline tax rate was 21.0% (2015 19.0%) and on reported profit before tax was 20.6% (2015 16.6%). The tax charge includes the release of provisions following the successful resolution of a number of tax matters during the year. The headline tax rate for 2017 is expected to be around 1% higher than 2016. Given the Group’s geographic mix of profits and the changing international tax environment, the tax rate is expected to increase slightly over the next few years. Reported profit after tax rose by almost 21% (over 7% in constant currencies) to £1.502 billion.
Diluted headline earnings per share rose by almost 21% to 113.2p from 93.6p. In constant currencies, earnings per share on the same basis rose by almost 8%. Reported diluted earnings per share rose by over 22% to 108.0p from 88.4p and increased well over 8% in constant currencies.
A record year, but not without challenges
The Group’s record performance in 2016, its sixth record year in a row, was achieved despite a generally low global growth, or tepid, environment. Top-line growth remained strong, with operating profits and margins meeting and exceeding targets and all regions and sectors showing growth on almost all metrics.
India remains the one BRIC star currently continuing to shine
Generally, the world seems trapped currently in a nominal GDP growth range of 3.5-4.0%. Historically, the BRICs or Next 11, located in Asia Pacific, Latin America, Africa & the Middle East and Central & Eastern Europe offered higher growth rates. After all, that is where the next billion consumers will come from. However, in the last few years Brazil, Russia and China have all faced various challenges and slowed, although India remains the one BRIC star currently continuing to shine. Whilst that diminishing growth gap has been countered somewhat by better prospects in the Next 11, CIVETS and MIST markets like Mexico, Colombia, Vietnam, Indonesia, the Philippines and Egypt, the growth rates of the mature markets of the US, the UK and Western Continental Europe have also improved, albeit from relatively low levels of growth.
That continues to be the case with the short to medium prospects in the US, at least, strengthening under the Trump administration, which is much more strongly pro-business, much more business-connected than the Obama administration, outlining planned pro-growth tax, infrastructure investment, spending and regulatory reform. The prospects in the UK are more mixed as the post-Brexit vote scenarios will play out over the next two years and uncertainties about the possible outcomes increase. Three of the four leading Western Continental European economies, Germany, France, Italy and Spain face elections or electoral uncertainty. Greece and Portugal also face continued economic uncertainty, and ECB Governor Mario Draghi's probable retirement in 2018/19 may bring policy uncertainty, although Germany and Spain are strengthening financially.
In these circumstances, clients face challenging top-line growth opportunities and uncertainties. And although inflation may pick up in the US because of stimulative economic policy and in the UK because of the weakness of sterling, generally inflation remains at low levels, resulting in limited pricing power. As a result, there remains considerable focus on the short-term and cost and the finance and procurement functions are dominant, certainly equal or more powerful than marketing, rightly or wrongly.
In addition, if you are running a legacy business, you are faced with three simultaneous discombobulating forces – technological disruption from disintermediators, those like Uber or Airbnb in the transportation and hospitality industries; the zero-based budgeting techniques of companies like 3G Capital, Reckitt Benckiser and Coty in consumer packaged goods and Valeant and Endo in the pharmaceutical industries (although their models have become somewhat discredited); and, finally, the attentions of activist investors such as Nelson Peltz, Bill Ackman or Dan Loeb.
Not helping either in focusing on the long-term, is the average term life of S&P 500 and FTSE 100 CEOs at 6-7 years, CFOs at 4-5 years and CMOs at 2-3 years. As a result, it is not surprising that since Lehman at the end of 2008, the combined level of dividend payments and share buy-backs as a proportion of retained earnings at the S&P 500 has steadily risen from around 60% of retained earnings to over 100%. In effect, managements are abrogating responsibility for reinvesting retained profits to their institutional investors. In fact, in seven of the last eight quarters the ratio has exceeded or almost reached 100%, tapering off in the last two quarters as stock market indices and share prices reached new highs and the relative attraction of buy-backs lessened.
Our 10-year experience of measuring brand valuation shows that the strongest innovators and strongest brands generate the strongest top-line growth and total shareholder returns
This emphasis on the short-term and consequent disinclination to invest for the long-term may be misplaced. Our over 10-year experience of measuring brand valuation clearly shows that the strongest innovators and strongest brands generate the strongest top-line growth and total shareholder returns. If you had invested equally over the last decade in the top 10 brands identified by our annual Financial Times/Millward Brown BrandZ Top 100 Most Valuable Global Brands survey, you would have outperformed the S&P 500 Index by over 70% and the MSCI by over four times. Investing in innovation and strong brands yields enhanced returns. Perhaps, surprisingly, corporate structures that seem to offend customary good corporate governance may deliver better long-term results. Controlled companies like the Murdochs’ Newscorp and Fox or the Roberts’ Comcast or Zuckerberg’s Facebook or Brin and Page’s Google or, now, Spiegel’s Snap may provide the confidence and stability needed to take the appropriate level of risk.
Given this macroeconomic background, it is not surprising that clients are generally grinding it out in a highly competitive ground game, rarely resorting to a passing game or Hail Marys. Recently, reported calendar 2016 results generally reflect this, for example, in the auto, retail, consumer packaged goods and pharmaceutical industries. Although top-line growth may be hard to find and guidance missed or just met, bottom lines are met or exceeded. As top-line growth opportunities become more and more pressurised, acquisitions and mergers become even more attractive as a growth opportunity, particularly if they present opportunities for significant cost synergies and relatively unleveraged balance sheets can be supplemented by still historically low-cost long-term debt.
Our industry is no different. Competition is fierce and as image in trade magazines, in particular, is crucial to many, account wins at any cost are paramount. There have been several examples recently of major groups being prepared to offer clients up-front discounts as an inducement to renew contracts, heavily reduced creative and media fees, extended payment terms, unlimited indirect liability for intellectual property liability and cash or pricing guarantees for media purchasing commitments, although the latter are difficult for procurement departments to measure and monitor. As some say, you are only as strong as your weakest competitor. These practices cannot last and will only result eventually in poor financial performance and further consolidation, the premium being on long-term profitable growth.
Not surprising then that your Company’s top-line revenue and net sales organic growth continues to hover around the 3%+ level and on a cumulative basis for the last two years over 6%, as it has done in previous sets of consecutive years. In the first half of 2016, growth was around 4%, due to weaker comparatives and in the second half at around 2% due to stronger comparatives.
Outlook for 2017
2017 is unlikely to be much different. There seems little reason for an upside breakout in growth in terms of worldwide GDP growth, or indeed a downside breakout, despite the possibility of an increase in interest rates in the short-term. Interest rates are likely to continue to remain at historically low relative levels, longer than some think. Whilst Trumponomics may well result in an increase in the US GDP growth rate and the US is the biggest ($18 trillion) GDP engine out of a total of $74 trillion worldwide, political uncertainties in Europe, West and East, the Chinese focus on qualitative growth and the longer-term recovery of Latin America, probably mean that stronger growth will be harder to find outside the US. America First, if the new Administration’s plans are implemented, will almost definitely mean a stronger American economy, at least in the short- to medium-term.
2017 is neither a maxi- or mini-quadrennial year, although it will be somewhat influenced by the build-up for the Pyeongchang Winter Olympics, FIFA World Cup in Russia and the mid-term Congressional elections, all in 2018. Nominal GDP growth should continue to grow in the 3.5-4% range, with advertising as a proportion remaining constant overall, with mature markets continuing at lower than pre-Lehman levels, counter-balanced by under-branded faster growth markets growing at faster rates. In our own case, budgets indicate top-line revenue and net sales growth of around 2%, reflecting the impact of a lower net new business record in the latter part of 2016, although new business activity and conversion rates currently remain high.
Our prime focus will remain on growing revenue and net sales faster than the industry average, driven by our leading position in horizontality, faster-growing geographic markets and digital, premier parent company creative and effectiveness position, new business and strategically targeted acquisitions.
At the same time, we will concentrate on meeting our operating margin objectives by managing absolute levels of costs and increasing our flexibility in order to adapt our cost structure to significant market changes and by ensuring that the benefits of the restructuring investments taken in 2015 and 2016 continue to be realised.
The initiatives taken by the parent company in the areas of human resources, property, procurement, information technology and practice development continue to improve the flexibility of the Group’s cost base. Flexible staff costs (including incentives, freelance and consultants) remain close to historical highs of above 8% of net sales and continue to position the Group extremely well should current market conditions deteriorate.
Our prime focus will remain on growing revenue and net sales faster than the industry average
The budgets for 2017 have been prepared on a cautious basis as usual (hopefully), but continue to reflect the faster-growing geographical markets of Asia Pacific, Latin America, Africa & the Middle East and Central & Eastern Europe and the faster-growing functional sub-sector of direct, digital and interactive, with a stronger second half of the year, reflecting the 2016 comparative. Our 2017 budgets show like-for-like revenue and net sales growth of around 2% and a target net sales margin improvement of 0.3 margin points excluding the impact of currency.
At the time of writing, we have revenue and profit data for the first two months of 2017. The Group has had a relatively slow start to the year, with like-for-like revenue growth up 0.3% in the first two months and net sales up 0.4% on the same basis, against a stronger comparative last year. Operating margins are ahead of budget for the first two months of the year.
All regions and sectors, except North America and Data Investment Management, showed revenue and net sales growth, with Public Relations & Public Affairs, digital, direct and interactive and the Specialist Communications businesses up the strongest. These trends are in line with our budgets, which also indicate a stronger rate of growth in the second half of the year.
Horizontality
Including associates and investments, the Group currently employs over 205,000 full-time people in over 3,000 offices covering 112 countries, now including Cuba and Iran, although in the latter case only through affiliations, because of effectively continuing sanctions. It services 360 of the Fortune Global 500 companies, all 30 of the Dow Jones 30, 78 of the NASDAQ 100 and 892 national or multinational clients in three or more disciplines. 596 clients are served in four disciplines and these clients account for over 53% of Group revenue.
The Group continues to improve co-operation and coordination among its operating companies... an objective which has been specifically built into short-term incentive plans
These statistics reflect the increasing opportunities for coordination and co-operation or horizontality between activities, both nationally and internationally, and at a client and country level. The Group also works with 462 clients in six or more countries. The Group estimates that well over a third of new assignments in the year were generated through the joint development of opportunities by two or more Group companies. Horizontality across clients, countries and regions and on which the Group has been working on for many years, is clearly becoming an increasingly important part of our client strategies, particularly as clients continue to invest in brand in slower-growth markets and both capacity and brand in faster-growth markets.
The Group continues to improve co-operation and coordination among its operating companies in order to add value to our clients’ businesses and our people’s careers, an objective which has been specifically built into short-term incentive plans. We have decided that up to half of operating company incentive pools are funded and allocated on the basis of Group-wide performance in 2016 and beyond. Horizontality has been accelerated through the appointment of 48 Global Client Leaders for our major clients, accounting for over one third of total revenue of almost $20 billion and Regional, Sub-Regional and Country Managers in a growing number of test markets and sub-regions, covering about half of the 112 countries in which we operate.
Emphasis has been laid on the areas of media investment management, healthcare, sustainability, government, new technologies, new markets, retailing, shopper marketing, internal communications, financial services and media and entertainment. The Group continues to lead the industry, in coordinating communications services geographically and functionally through parent company initiatives and winning Group pitches.
Whilst talent and creativity (in the broadest sense) remain key potential differentiators between us and our competitors, increasingly differentiation can also be achieved in three additional ways – through application of technology, for example, Xaxis, AppNexus and Triad; through integration of data investment management, for example, Kantar and comScore (now merged with Rentrak); and through investment in content, for example, Imagina, VICE, Media Rights Capital, Fullscreen, Imagine, Indigenous Media, China Media Capital, Bruin Sports Capital and Refinery29.
In addition, strong and considered points of view on the adequacy of online and, indeed, offline measurement, on viewability, on internet fraud and transparency, on online media placement and brand safety and, finally, on fake news are all examples where further differentiation is important and can be secured through considered initiatives. With its leadership position, as the world’s largest media investment management operation, GroupM has developed a strong united point of view with its leading clients and associates, like AppNexus, in all these areas and has aligned with Kantar’s data investment management capabilities, for example, through comScore, to provide better capabilities. These philosophical differences and operational capabilities are extremely effective in responding to the trade association and regulatory issues that have been raised recently.
Four core strategic priorities
Our reason for being, the justification for WPP’s existence, continues to be to add value to our clients’ businesses and our people’s careers. Our goal remains to be the world’s most admired, creative and respected communications services advisor to global, multinational, regional and local companies.
To that end, we have four core strategic priorities.
- Advance the practice of ‘horizontality’ (connected know-how) by ensuring our people work together for the maximum benefit of clients: through cross-Group Communities and Practices, Global Client Teams, and Regional, Sub-Regional and Country Managers.
- Increase the combined geographic share of revenues from the faster-growing markets of Asia Pacific, Latin America, Africa & Middle East and Central & Eastern Europe to 40-45% of revenues.
- Increase the share of revenues from new media to 40-45% of revenues.
- Maintain the share of more measurable advertising and marketing services – such as data investment management and direct, digital and interactive – at 50% of revenues, with a focus on the application of technology, data and content.
If we implement this strategy effectively then our business will be geographically and functionally well-positioned to compete successfully and to deliver on our long-term financial targets:
- Revenue and net sales growth greater than the industry average.
- Annual improvement in net sales margin of 0.3 margin points or more, excluding the impact of currency, depending on net sales growth and staff cost-to-net sales ratio improvement of 0.2 margin points or more.
- Annual diluted headline EPS growth of 10% to 15% delivered through revenue and net sales growth, margin expansion, acquisitions and share buy-backs.
Our six specific objectives
Here are six objectives which represent our key performance indicators (KPIs). For an assessment of how we performed against them in 2016, read on.
- Continue to improve operating margins on net sales.
- Increase flexibility in the cost structure.
- Use free cash flow to enhance share owner value and improve return on capital employed.
- Continue to develop the value added by the parent company.
- Emphasise revenue and net sales growth more as margins improve.
- Improve still further the creative capabilities and reputation of all our businesses.
1
First, to continue to improve operating margins. In 2016, we achieved an industry-leading margin of 17.4% on net sales. We continue to believe a margin of well over 19% on net sales, is a tough, but realistic, objective given that our best-performing companies in each services sector have already demonstrated they can perform at a combined Group margin of 18% on net sales. The Group has embarked on a number of programs to improve operational effectiveness including process simplification, shared service centres, offshoring certain tasks to lower-cost markets and, where appropriate, outsourcing. We are consolidating IT infrastructure and services, and centralising systems development and applications to create efficiencies and focus investment. These programs are projected to deliver a 1.0 margin point benefit (excluding the impact of currency) over the course of the next two to four years.
2
Second, to increase flexibility in the cost structure. In 2016, flexible staff costs (including incentives, freelance and consultants) remained close to historical highs of above 8% of net sales and continue to position the Group extremely well should current market conditions deteriorate.
Change in variable costs %
Headline operating margins1 vs peers %
- WPP including associates
- WPP
- Publicis
- Havas
- Omnicom
- IPG
3
Third, to enhance share owner value and maximise the return on investment on the Company’s substantial free cash flow of almost £1.6 billion (or almost $2.2 billion) per annum. As capital expenditure remains relatively stable, our focus is on the alternative uses of funds between acquisitions, share buy-backs and dividends. We have increasingly come to the view that, currently, the markets favour consistent increases in dividends and higher sustainable payout ratios, along with anti-dilutive progressive buy-backs and, of course, sensibly-priced, small- to medium-sized strategic acquisitions.
-
Mergers and acquisitions. There is still a very significant pipeline of reasonably priced small- and medium-sized potential acquisitions, with the exception perhaps of digital in the US, where prices seem to have got ahead of themselves because of pressure on competitors to catch up. This is clearly reflected in some of the operational issues that are starting to surface elsewhere in the industry, particularly in fast-growing markets like China, Brazil and India.
Our acquisition focus in 2016 was again on the triple play of faster-growing geographic markets, new media and data investment management, including the application of technology, data and content, totally consistent with our strategic priorities in the areas of geography, new communication services and measurability. In 2016, the Group spent over £600 million on initial acquisition payments, net of cash acquired and disposal proceeds.
Net acquisition spend is currently targeted at around £300 to £400 million per annum, excluding slightly more significant ‘one-offs’, like IBOPE in Latin America, comScore and Triad. We will continue to seize opportunities in line with our strategy.
-
Dividends. As outlined in the June 2015 AGM statement, the achievement of the previously targeted payout ratio of 45% one year ahead of schedule, raised the question of whether the payout ratio target should be increased further. Following that review, your Board decided to up the dividend payout ratio to a target of 50%, to be achieved by 2017, and, as a result, declared an increase of almost 23% in the 2016 interim dividend to 19.55p per share, representing a payout ratio of 50% for the first half. This had the effect of evening out the payout ratio between the two half-year periods and consequently balancing out the dividend payments themselves, although the pattern of profitability and hence dividend payments seems likely to remain one-third in the first half and two-thirds in the second half.
Our acquisition focus was again on the triple play of faster-growing geographic markets, new media and data investment management
Given your Company’s strong progress, your Board proposes an increase of almost 29% in the final dividend to 37.05p per share, which, together with the interim dividend of 19.55p per share, makes a total of 56.60p per share for 2016, an overall increase of almost 27%. This represents a dividend payout ratio of 50%, compared to a payout ratio of 47.7% in 2015, reaching the recently targeted payout ratio of 50% one year ahead of schedule. Dividends paid in respect of 2016 will total approximately £720 million for the year.
Your Board will continue to review the question of whether the dividend payout ratio should be further increased, particularly given the continuing attractive opportunities to reinvest retained earnings in the business.
Distributions to share owners1 £m
- Share buy-backs. They continue to be targeted to absorb any share dilution from issues of options or restricted stock. However, given the net sales margin target of 0.3 margin points improvement, the targeted level of share buy-backs will be 2-3% of the outstanding share capital. If achieved, the impact on headline diluted EPS would be equivalent to an incremental improvement of 0.2 margin points.
In addition, the Company also has considerable free cash flow to take advantage of any anomalies in market values, particularly as the average 2016 net debt-to-EBITDA ratio was under 1.8 times, at the mid-point of our market guidance of 1.5-2.0 times. Share buy-backs in 2016 cost £427 million, representing 2.0% of issued share capital.
In 2016, funds returned to share owners were over £1.0 billion. In the last five years, £4.2 billion has been returned to share owners and, over the last 10 years, £5.9 billion.
4
Fourth, we will continue to develop the value added by the parent company and build unique integrated marketing approaches for clients. WPP is not just a holding company focused on planning, budgeting, reporting and financial issues, but a parent company that can add value to our clients and our people in the areas of human resources, property, procurement, IT and practice development, including sustainability. We will continue to do this through a limited group of 400 or so people at the centre in London, New York, Hong Kong, Singapore, Shanghai and São Paulo. This does not mean that we seek to diminish the strength of our operating brands, but rather to learn from one another. Our objective is to maximise the added value for our clients in their businesses and our people in their careers.
Many of our initiatives are possible because of the scale on which we now operate. In the optimum use of property, in IT and in procurement generally, we are able to achieve efficiencies that would be beyond the reach of any individual operating company. But it is also clear that there is an increasing requirement for the centre to complement the operating companies in professional development and client coordination. It is a relatively recent development for certain multinational marketing companies, when looking to satisfy their global communications needs, to make their initial approach not to operating companies, but directly to holding or parent companies.
Such assignments present major, and increasingly frequent, opportunities for the few groups of our size. It is absolutely essential that we have the professional resources and the practice development capability to serve such clients comprehensively, actively and creatively. Initiatives involving some of the world’s largest marketers continue to gain momentum. The world’s largest advertiser is itself integrating its efforts around brands, in the areas of advertising, media investment management, market research, packaging design and public relations. For our largest client, amongst others, we have implemented a seamless model, effectively a one-client agency within our Group. All our clients, whether global, multinational or local, continue to focus on the quality of our thinking, coordination of communications and price. In response, we focus on talent, structure and incentives.
Managing talent is the priority
Talent and its management therefore remain at the heart of our reason to be: that is what our clients pay us for. Development of our people and the way we manage that talent is a critical determinant of performance and one on which we continue to make significant progress.
In developing highly-competitive incentives combined with extremely attractive working environments, we increasingly differentiate ourselves from our competitors and improve the attractiveness of WPP companies as destinations for talent. Our quarterly reviews with the operating companies are structured to give time and attention to talent and to clients. Our recruiting efforts throughout 2016 were fruitful as we successfully targeted and recruited top talent within and beyond our industry, often competing with investment banking, management consulting, new media and private equity offers. The war for talent is fierce and will intensify further and with lower birth rates forecast we need to ensure we are an attractive employer for a young workforce.
The blueprint for our executive development curriculum has been completed. Our flagship client leadership training program, Maestro, now in its 14th year, continues to help us strengthen the effectiveness and confidence of senior client practitioners and to achieve horizontality in our ways of working. The parent company and each of our operating companies have installed their own approach to performance assessment and succession planning, aimed at developing the careers of their people, improving the quality of feedback, coaching and mentoring they receive and providing for orderly succession.
A diverse workforce is more collaborative, creative and effective and there is clear evidence that businesses with greater diversity in their leadership perform better than the competition. We continued to make diversity a focus during 2016, particularly as we continue to face challenges, including our senior leadership programs such as ‘The X Factor’, which prepares women for the next level of leadership in the Group, as well as the work of our WPP Stella women’s network in the UK (More information about additional programs, including WPP Stella, appears in the Sustainability review of this report.) and initiatives such as Walk the Talk, an intensive coaching program for women that began at Maxus and is being adopted in other parts of the Group. Women now account for 54% of our employees and 34% of our executive leaders, the latter which is clearly not good enough.
There is clear evidence that businesses with greater diversity in their leadership perform better than the competition
In 2011, your Company teamed up with the Shanghai Art & Design Academy to establish the WPP School of Marketing and Communications. This jointly-run school offers China’s first professional marketing and communications three-year diploma program. In 2015, WPP partnered with the Indian School of Design and Innovation to offer a three-year undergraduate course on marketing communications; and, in 2016, your Company announced the launch of the WPP Africa Academy in Johannesburg, South Africa, in collaboration with the Red & Yellow School of Logic and Magic. This initiative enables WPP companies across Africa to access high quality, relevant and cost-effective training programs for their agency people. Now WPP and Ogilvy UK are partners in Pearson Business School’s new Rotational Degree Apprenticeship program, an alternative to traditional degree courses and a new approach for education in the UK.
After more than 20 years, the WPP Fellowship program remains (surprisingly) the only multidisciplinary and multi-geographical recruitment and training initiative in the industry, with a lower acceptance rate than Harvard Business School’s MBA program. 194 Fellows have gone through or are participating to date. This is just one of the ways we seek to attract the next generation of diverse talent into our industry – across the Group our companies offered over 6,400 paid internships and apprenticeships in 2016.
To be successful in our industry requires us to offer competitive compensation that allows us to attract the best talent and then ensure we reward them for their achievements and retain them for the long-term benefit of the Group. We do this by ensuring that our compensation levels are aligned to competitors (which is becoming increasingly difficult, particularly against US competitors) and the range of benefits we provide is attractive and designed to meet the needs of all our people.
Communications
At the heart of our internal communications activity is the sharing of company news, information, connections and thinking within and across the Group to promote an understanding of our constituent parts, to demonstrate our collective thought leadership and, specifically, to support WPP’s focus on horizontality. We do this through our multi-awarded quarterly global newspaper and ebook, The WIRE; regular internal emails, regional communicators’ meetings and company FactFiles; the promotion of Group initiatives such as the Atticus Awards, BrandZ studies and WPP Partnership Awards; and our intranet content. The Group intranet now holds an extensive database of WPP talent, as well as a comprehensive range of business and personal development resources.
We aim to be a model of excellence in our external communications, through our social media channels, website content and in print. These include: frequent tweets on noteworthy matters; our monthly public news ebulletin; topical articles by the WPP CEO in global and national media; our proprietary BrandZ studies; our annual Atticus Journal of original thinking in communications services; WPPED Cream creative winners; and our consistently-awarded Sustainability Reports and Annual Reports. In the first quarter of 2017, wpp.com was ranked in the top five of 500 corporate websites assessed for accessibility by SiteMorse.
Property management
In 2016, the Group’s property portfolio increased by approximately 1% to 24.2 million square feet, reflecting the impact of space acquired through acquisitions (including 0.4 million square feet following the merger with STW Communications Group Limited in Australia), partly offset by the benefit of more ‘agile working’, supported by more technology in the office environment. Establishment costs increased by 5.8% on a constant currency basis, which compares with net sales growth on the same basis of over 7% and average headcount growth of over 6%. As a result, the establishment cost-to-net-sales ratio dropped by 0.2 margin points (for the second consecutive year) to 6.7%, contributing substantially to the Group’s overall margin improvement.
We have also ensured our new buildings are designed to focus on sustainability and we look to achieve BREEAM Very Good in the UK and LEED Gold in the US and similar standards elsewhere. Our operating companies’ workplaces continue to be cited for their creativity, innovation and effectiveness.
2016 saw the completion of our Shanghai WPP Campus colocation, housing more than 3,000 of our people, the shared space at Sea Containers House in London housing 2,300 people, and the renovation of our shared space on Lexington Avenue in New York. These new colocation projects all meet our new planning standards and support our horizontality goal. Longer-term colocation projects are in the planning stage for New York, São Paulo, Amsterdam, Milan, Lisbon and central Madrid, where the former Telefónica building will house more than 30 Group companies and 2,500 people.
Our operating companies’ workplaces continue to be cited for their creativity, innovation and effectiveness
Our goal is to continue to deliver excellent workspace, while reducing the portfolio further and so mitigate the impact of property inflation. Our focus on continuing to reduce the establishment cost-to-net-sales ratio will help the Group achieve its margin targets for 2017, and beyond.
Procurement
In procurement, our goal is to make savings, add value and minimise risk across all of WPP’s external spend, with particular emphasis on opportunities to leverage our scale to the benefits of our clients and our companies.
In 2016, we continued to implement and develop a spend analytics system, which now provides supplier-level and category visibility of over $5 billion of external spend, across 15 of our largest markets around the world. Capturing and making sense of ‘big data’ is increasingly driving procurement opportunity assessment and new project activities across the Group.
For 2017, we will continue our focus on the key drivers of supplier cost, combined with an increased emphasis on internal demand management (what we buy, why we buy and how we buy). For indirect procurement, our goal remains to have a minimum of 50% supplier spend in each major country covered by WPP preferred suppliers and contracts, and for these preferred suppliers to work with us to deliver year-on-year value improvement.
2016 was the second year of our multi-year program to transform the Group’s IT capability. In June 2016, we commissioned four new regional world-class cloud-enabled data centres and have begun to transfer our legacy server estate into these new facilities, along with the rollout of tooling to enable the remote management of our servers, PCs and network estate.
Continuing to support horizontality and the enablement of WPP’s finance shared services strategy, we completed the build of our new core ERP system, with the first deployments scheduled to go-live from the second quarter of 2017.
In 2016, we strengthened our strategic partnership with Adobe, with a global agreement to deploy Adobe’s creative cloud technology throughout our agencies to support creativity, collaboration and horizontality.
Practice development
In practice development, we continue to develop horizontal initiatives in a focused set of high-potential areas across our vertical operating brands: in Media Investment Management, healthcare, sustainability, government, new technologies, new markets, retailing, shopper marketing, internal communications, financial services and media and entertainment. Specifically, we continue to invest in sharing insights and developing initiatives through WPP Digital (in digital marketing and media), The Store (in distribution and retail), our Government & Public Sector Practice, WPP Health & Wellness and The WPP Sports Practice.
In key geographic markets we are increasingly coordinating our activities through WPP Regional, Sub-Regional and Country Managers. We continue to believe that increasing coordination is required between our brands at global and country levels, as the arguments for investment in regional management become weaker, partly because of improved technology and client reorgansation to achieve cost reduction. In addition, we have increased the number of WPP Global Client Leaders to coordinate our efforts on behalf of clients and to ensure they receive maximum benefit from their relationships with WPP regional operating brands.
We continue to believe that increasing coordination is required between our brands at global and country levels
Furthermore, we continue to encourage internal strategic alliances and promote co-operation. Practice development initiatives have therefore been reinforced in such areas as healthcare, retail, internal communications, corporate sustainability and media and entertainment.
This has been especially important in developing our portfolio of direct investments in new media under WPP Digital and WPP Ventures and where our investments are working with our agencies and people to bring new technology capabilities and understanding to our clients.
All these initiatives are designed to ensure that we, the parent company, really do (as well as being perceived to) inspire, motivate, coach, encourage, support and incentivise our operating companies to achieve their strategic and operational goals.
5
Fifth, to emphasise revenue and net sales growth more as margins improve. One legitimate criticism of our performance against the best-performing competition has been our comparative level of organic revenue growth, although the methods used to calculate rates of organic growth ‘vary’ to say the least and we may have put too much emphasis on margin improvement, where we outperform. Like-for-like revenue growth of 3.0% and net sales growth on the same basis of 3.1% was (we believe) more than respectable. Our net sales margin was up 0.5 margin points to an industry-leading 17.4%. We continue to believe that profitable growth is preferable to sacrificing margins.
Estimated net new business billings of £4.4 billion ($6.8 billion) were won in the year, continuing the good performance seen in the first nine months, although comparatively weaker in the fourth quarter, following the particularly successful media wins in the final quarter of 2015. Generally, the Group continues to benefit from consolidation trends in the industry, winning assignments from existing and new clients, including several very large industry-leading advertising, digital, media, pharmaceutical and shopper marketing assignments, which partly benefited the latter half of 2016, although offset, to some extent, by a couple of significant media losses. There is, probably, more sizeable net new business to come, reflecting the Group’s differentiation in horizontality, technology, data and content.
Our acquisition activities are also aimed at helping us position our portfolio in the faster-growing geographic and functional areas. The Group completed 56 transactions in the year: 20 acquisitions and investments were in new markets; 38 in quantitative and digital; and 10 were driven by individual client or agency needs. Out of all these transactions, 12 were in both new markets and quantitative and digital.
Specifically, in 2016, acquisitions and increased equity stakes have been completed in Advertising and Media Investment Management in the US, Canada, the UK, Turkey, Argentina, Brazil and Ecuador; in Data Investment Management in the US, Denmark, Greece, India and New Zealand; in Public Relations & Public Affairs in Canada, Switzerland, Turkey, Kenya, India and Brazil; in Branding & Identity in the Netherlands and Hong Kong; in direct, digital and interactive in the US, the UK, France, Germany, the Netherlands, Turkey, China, Singapore, South Korea, Brazil, Colombia and Mexico; in Healthcare Communications in the US; and in sports marketing in the US.
A further seven acquisitions and investments were made in the first two months of 2017, with three in Advertising and Media Investment Management; two in Data Investment Management; and two in direct, digital and interactive.
These acquisitions continue to target our previously-described strategic priorities; expanding the share of revenues of our businesses in Asia Pacific, Latin America, Africa & Middle East and Central & Eastern Europe to 40-45%; in new media to 40-45%; and in Data Investment Management, direct, digital and interactive, to one-half.
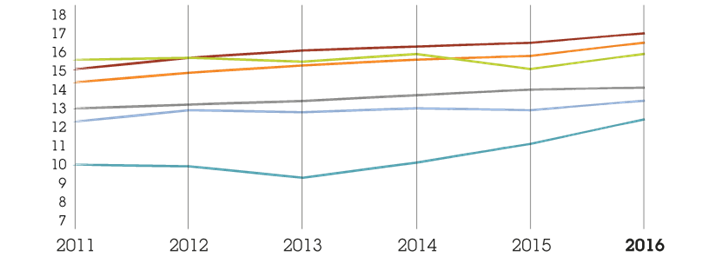
Revenue in faster-growing markets 2012-2015 $bn
- WPP
- Dentsu JPN1
- Dentsu
- Omnicom2
- Publicis2
- IPG2,3
- Havas2
Organic revenue growth vs peers %

- WPP
- WPP net sales
- Dentsu net sales1,2
- Omnicom1
- Publicis1
- IPG1
- Havas1
Expansion plans
We intend to expand our strong networks – J. Walter Thompson Worldwide, Ogilvy, Y&R, Grey, Scangroup, Mindshare, MEC, MediaCom, Maxus, tenthavenue, Kantar, Hill+Knowlton Strategies, Burson-Marsteller, Cohn & Wolfe, Brand Union, Landor, FITCH, WPP Health & Wellness, Wunderman, Geometry Global, POSSIBLE and AKQA – in high-growth markets or where their market share is insufficient.
We will also enhance our leadership position in Data Investment Management by further development of our key brands with particular emphasis on North America, Asia Pacific, Latin America and Continental and Eastern Europe. We will continue our growth of data panels and have established a Kantar-wide operational capability. We will reinforce our growing position in media research through Kantar Media and Kantar IBOPE Media. This includes our investments in television and internet audience research and Marktest, Finpanel and CSM/CTR, which on a combined basis is the market leader outside North America. With our licensee partners in Europe and Asia Pacific, we currently measure television and/or internet audiences in 52 markets around the world.
In addition, we intend to reinforce our worldwide strength in digital marketing and data through our traditional channels such as Wunderman, Ogilvy, Geometry Global, Blanc & Otus and Lightspeed. We will also invest directly in new channels through start-ups, particularly as US valuations in search, for example, are still prohibitive. Other opportunities will be sought to enhance our online capabilities.
Lastly, we will continue to develop our specialist expertise in areas such as healthcare, retail and interactive and to identify new high-growth areas.
Creativity remains paramount
6
Sixth, to build on, still further, the impressive creative reputation WPP now enjoys globally.
The creative capability of the Group is led by John O’Keeffe, WPP’s worldwide creative director. John reminds us constantly that while many issues facing WPP are very important – margin growth, acquisitions, geographical spread and the like – the creative quality of the work will always be priority No.1. We live or die by the ideas we deliver to our thousands of clients: design ideas, media and digital ideas, consumer insights and, of course, Kantar Millward Brown’s influential BrandZ studies which is being combined with Y&R’s equally influential BrandAsset® Valuator.
Training and development programs remain a key focus, as of course does the judicious use of our M&A skills to identify the best and most like-minded creative businesses to join us.
In 2016, we celebrated our 10th annual internal WPPED Cream awards, showcasing what we consider our very best work. wppedcream.com is a key online destination website for anyone searching for the very best in marketing creative excellence.
For those of us concerned with marketing that actually works, it’s common to say that, in order to be effective, you need to be creative. Maybe we should start saying that in order to be creative you need to be effective. Because we do appear to have proven both tenets. For a record sixth time in a row, our peers across the entire industry voted WPP Creative Holding Company of the Year at the Cannes International Festival of Creativity and Ogilvy for the fifth consecutive year as the most creative agency network. Four WPP agency networks, Ogilvy, Y&R, Grey and J. Walter Thompson Worldwide finished in the top seven networks at Cannes in 2016, in positions one, three, six and seven respectively, an outstanding achievement. Grey New York and INGO Stockholm were also voted the second and third most creative agencies in the world. For the fifth consecutive year, WPP was named Most Effective Holding Company in the Effie Global Effectiveness Index, with Ogilvy ranked the most effective agency. For the third consecutive year, WPP was ranked the World’s Top Holding Company by Warc.
Assessing and managing our risks
Risk management and internal control
We recognise that the success of the strategic objectives of the Group discussed in this report depends to a significant extent on the identification, understanding of and response to the risks that the Group faces. The Board, with support from the Audit Committee, has overall responsibility for the system of internal control and risk management in the Group. It has reviewed the design and effectiveness of the system during the year and up to the date of this report and carried out a robust assessment of the principal risks facing the Group. The system of controls described below is designed to manage or mitigate, but may not eliminate, the risks of failure to achieve WPP’s strategic objectives and is not an absolute assurance against material misstatement or loss.
Control environment and culture
The quality and competence of our people, their integrity, ethics and behaviour and the culture embedded within the Group are all vital to the maintenance of the Group’s system of internal control.
The Code of Business Conduct, which is regularly reviewed by the Board and was updated in 2016, sets out the principal obligations of all employees. Senior executives throughout the Group are required to sign this Code each year and all employees are required on joining the Group, and at regular intervals, to complete the WPP How We Behave, Anti-Bribery and Corruption, and Privacy & Data Security Awareness training modules, which embed all of the principles of the Code in addition to operating company training programs. The WPP Policy Book, which is updated with control bulletins, includes required practices in many operational, tax, legal and human resource areas. Breaches or alleged breaches of the Code are investigated by the director of internal audit, head of compliance, the Group chief counsel and external advisers where appropriate. Group companies are also required to follow the Data Code of Conduct and apply the Supplier Code of Conduct.
During 2017, we will launch a sustainability self-assessment questionnaire to all WPP offices to help us identify gaps in implementation focusing on governance, employment practices, environment and supply chain. The Company will use the results of the assessment to prioritise companies for further engagement including on-site assessments and training.
The Group has an independently operated helpline, Right to Speak, to enable our people to report issues that they feel unable to raise locally, and anonymously, if necessary. Through 70 calls to this helpline, a number of issues have been raised during 2016, all of which have been followed through and investigated where appropriate and reported to the Audit Committee. The Compensation Committee continues to review how the Group’s performance rewards support the risk management and internal control systems. Clawback provisions were adopted in 2016 and discussed in How we behave and how we’re rewarded underline the principles of the Code of Conduct.
Risk assessment
The Group uses a three lines of defence model in relation to risk management.
First, each operating company undertakes monthly and quarterly procedures and day-to-day management activities to review their operations and business risks, supported by Group policies, training and guidance on required internal controls over financial reporting and monitoring controls and reviews within their network.
Secondly, the operating network reviews are formally communicated to the Group chief executive, the Group finance director and senior parent company executives in monthly reports and quarterly review meetings and, in turn, to the Board. At each Board meeting, the Group chief executive presents a Brand Check review of each of the business’ operations, including an assessment of the risk in each business, providing feedback on the business risks and details of any change in the risk profile since the last Board meeting. The Brand Check includes the possibility of winning or losing major business, succession and the addition or loss of a key executive; introduction of new legislation in an important market; sustainability, including risks relating to marketing ethics, privacy, diversity and employment; political instability and changes in accounting or corporate governance practice.
Thirdly, internal audit at the Company, with Audit Committee oversight and external resource as required, provides an independent review of risk management and internal control via internal audits and management of the testing program for SOX.
Control activities and monitoring
Policies and procedures for all operating companies are set out and communicated in the WPP Policy Book, internal control bulletins and accounting guidelines. The application of these policies and procedures is monitored within the individual businesses and by the director of internal audit, compliance functions centrally and at the operating companies and the WPP Group chief counsel and heads of legal at the operating companies.
Operating companies are required to maintain and update documentation of their internal controls and processes. This documentation incorporates an analysis of business risks, detailed control activities and monitoring, together with IT and financial controls and controls over security of data and the provision of timely and reliable information to management.
The internal audit department was responsible for reviews and testing of the documentation and the relevant controls for a majority of the Group during 2016, the results of which were reported to the Audit Committee.
Financial reporting
Each operating company annually updates a three-year strategic plan, which incorporates financial objectives. These are reviewed by the parent company’s management and are agreed with the chief executive of the relevant operating company.
The Group operates a rigorous procedure for the development of operating company budgets, which build up the Group’s budget. During the final quarter of each financial year, operating companies prepare detailed budgets for the following year for review by the parent company. The Group’s budget is reviewed by the Board before being adopted formally. Operating company results are reported monthly and are reviewed locally, regionally and globally by the business groups and by Group management on a consolidated basis and ultimately by the Board. The results are compared to budget and the previous year, with full-year forecasts prepared and updated quarterly throughout the year.
At each year-end, all operating companies supply their full-year financial results with such additional information as is appropriate. This information is consolidated to allow the Group to present the necessary disclosures for International Financial Reporting Standards (IFRS) as adopted by the European Union and issued by the IASB.
The Disclosure Committee gives further assurance that publicly-released information is free from material omission or misstatement.
Principal risks and uncertainties
The Board has carried out a robust assessment of the principal risks and uncertainties affecting the Group as at 31 December 2016 and up to the date of this report and which are described in the table on the following pages. These risks relate to the Group and the industry in which we operate and the strategic decisions taken by the Board. A risk dashboard and map are discussed regularly by the Audit committee and bi-annually by the Board.
| Key: |
|
| Increased risk |
 |
| No change from last year |
 |
| Reduced risk |
 |
| Principal risks |
Potential impact |
How it is managed and reflected in our strategic priorities |
| Clients |
|
The Group competes for clients in a highly-competitive and evolving industry and client loss to competitors or as a consequence of consolidation in client markets or a reduction in marketing budgets due to economic conditions may have a material adverse effect on the Group’s market share and its business, revenues, results of operations, financial condition or prospects.

|
The competitive landscape in the industry in which we operate is constantly evolving. Competitors include large multinational advertising and marketing communication companies and regional and national marketing services companies, database marketing and modelling companies, telemarketers, information and measurement, social media and professional services and advisory firms and consulting internet companies.
Agreements with clients are generally terminable by the client on 90 days’ notice or are on an assignment basis and many clients put their business up for competitive review from time to time. The ability to attract new clients and to retain or increase the amount of work from existing clients may be impacted by loss of reputation and be limited by clients’ policies on conflicts of interest.
The global economy continues to be volatile with uncertainties such as those caused by Brexit in the UK and Europe and technological disruption from disintermediators in certain sectors. In the past clients have responded to weak economic and financial conditions by reducing their marketing budgets which are easier to reduce in the short term than their other operating expenses. The risk of client loss or reduction in marketing budgets has increased.
|
To continue to improve the creative capability and reputation of the Group’s businesses and embed an ethical culture that attracts and retains talent and clients.
The Group’s different agency networks limit potential conflicts of interest and the Group continues to improve co-operation and coordination across the operating companies, adding value to client businesses.
The appointment of 48 Global Client Leaders for major clients and going forward half of incentive pools to be funded and allocated based on Group-wide performance.
Differentiation from competitors through talent and creativity and by application of technology, integration of data investment management and investment in content.
Brand Check at every Board meeting to identify the potential risk of client loss.
|
|
The Group receives a significant portion of its revenues from a limited number of large clients and the net loss of some of these clients could have a material adverse effect on the Group’s prospects, business, financial condition and results of operations.
|
A relatively small number of clients contribute a significant percentage of the Group’s consolidated revenues. The Group’s 10 largest clients accounted for 15.5% of revenues in the year ended 31 December 2016. Clients generally are able to reduce advertising and marketing spend or cancel projects on short notice. The loss of one or more of the Group’s largest clients, if not replaced by new client accounts or an increase in business from existing clients, would adversely affect the Group’s financial condition.
|
Global Client Leaders, horizontality and the ‘Team’ model seeks to ensure the Group maintains partnership relationship with major clients. Operating companies seek to establish reputations, talent and technical capability in the industry and an ethical and diverse culture that attract and retain clients and key talent.
Increase flexibility in the cost structure (including incentives, consultants and freelancers).
Brand Check at every Board meeting and regular dialogue between Executive Directors of the Company and directors of the Group’s largest clients.
|
| Cyber and data security |
|
The Group is subject to strict data protection and privacy legislation in the jurisdictions in which it operates and relies extensively on information technology systems. The Group stores, transmits and relies on critical and sensitive data such as strategic plans, personally identifiable information and trade secrets. Security of this type of data is exposed to escalating external threats that are increasing in sophistication as well as internal data breaches.
Existing and new data protection laws, in particular the GDPR and E-privacy regulation in the EU concerning user privacy, use of personal information, consent and online tracking may restrict some of the Group’s activities and increase costs.
The Group is carrying out an IT Transformation project and is reliant on third parties for the performance of a significant portion of its worldwide information technology and operations functions. A failure to provide these functions could have an adverse effect on our business.
|
The Group may be subject to investigative or enforcement action or legal claims or incur fines, damages, or costs and client loss if the Group fails to adequately protect data or observe privacy legislation in every instance. A system breakdown or intrusion could have a material adverse effect on the Group’s business, revenues, results of operations, financial condition or prospects.
|
The Group assists the operating companies in developing principles on privacy and data protection and compliance with local laws. The Group has commenced extensive training ahead of GDPR implementation in 2018 and the roll out of a GDPR toolkit to assist the operating companies to prepare for implementation.
Nominated senior executives provide leadership on privacy and data protection.
Our people are required to take Privacy & Data Security Awareness training and understand the WPP Data Code of Conduct and WPP policies on data privacy and security.
The WPP Data Health Checker survey is performed annually to understand the scale and breadth of data collected by WPP agencies, so the level of risk associated with this can be assessed.
The IT Transformation project will enhance the Group’s data security. In addition, the Group has established a global internal IT company responsible for providing core IT shared services to all Group companies and manage external technology providers.
|
| Financial |
|
The Group is subject to credit risk through the default of a client or other counterparty.
|
The Group is generally paid in arrears for its services. Invoices are typically payable within 30 to 60 days.
The Group commits to media and production purchases on behalf of some of its clients as principal or agent depending on the client and market circumstances. If a client is unable to pay sums due, media and production companies may look to the Group to pay such amounts to which it committed on behalf of those clients.
|
Evaluating and monitoring clients’ ongoing creditworthiness and in some cases requiring credit insurance or payments in advance.
The Group’s treasury position is a recurring agenda item for the Audit Committee and the Board.
|
| Operational |
|
The Group’s performance could be adversely impacted if it failed to ensure adequate internal control procedures are in place in relation to the Group’s media trading.
|
Failure to ensure that trading activities are compliant with client obligations where relevant could adversely impact client relationships and business volumes.
|
The principles of adherence to the terms of client contracts are embedded through the networks and reinforced by audits at a WPP and network level.
Regular monitoring of KPIs for trading are undertaken to identify trends and issues.
An authorisation matrix on inventory trading is agreed with the Company and the Audit Committee.
|
| People and succession |
|
The Group’s performance could be adversely affected if it were unable to attract and retain key diverse talent or had inadequate talent management and succession planning for key roles at the parent and operating companies, including but not limited to the founder CEO and long-serving members of the management team.
|
The Group is highly dependent on the talent, creative abilities and technical skills of our personnel as well as their relationships with clients. The Group is vulnerable to the loss of personnel to competitors and clients leading to disruption to the business.
The founder CEO has over 30 years’ service with the Company and is identified with the success of the Group’s strategy and a failure to plan for his succession could impact investor confidence in the Company.
|
The Group’s incentive plans are structured to provide retention value, for example by paying part of annual incentives in shares that vest two years after grant date.
The Group seeks to establish reputations in the industry that attract and retain talented and diverse personnel, including by improving the quality of their creative output and by offering competitive performance-based compensation and by providing extremely attractive working environments.
Succession planning for CEO, CFO and key executives of the Company is undertaken by the Board and Nomination and Governance Committee on a regular basis and a pool of potential internal and external candidates identified in emergency and planned scenarios.
Compensation Committee oversight for the Group’s incentive plans and compensation.
|
| Regulatory, sanctions, anti-trust and taxation |
|
The Group may be subject to regulations restricting its activities or effecting changes in taxation.
|
Changes in local or international tax rules, for example prompted by the OECD’s Base Erosion and Profit Shifting project (a global initiative to improve the fairness and integrity of tax systems), or new challenges by tax or competition authorities, may expose the Group to significant additional tax liabilities or impact the carrying value of our deferred tax assets, which would affect the future tax charge.
|
The Group actively monitors any proposed regulatory or statutory changes and consults with government agencies and regulatory bodies where possible on such proposed changes.
Annual briefings to the Audit Committee of significant changes in tax laws and their application and regular briefings to the Executive Directors. The Group engages advisors and legal counsel to obtain opinions on tax legislation and principles.
The Group will introduce new training and control procedures in 2017 in response to the introduction of the new offences in the UK of failure to prevent the facilitation of UK or foreign tax evasion.
|
|
The Group is subject to strict anti-corruption, anti-bribery and anti-trust legislation and enforcement in the countries in which it operates.

|
The Group operates in a number of markets where the corruption risk has been identified as high by groups such as Transparency International. Failure to comply or to create a corporate environment opposed to corruption or failing to instil business practices that prevent corruption could expose the Group and senior officers to civil and criminal sanctions.
|
Online and in-country ethics, anti-bribery, corruption and anti-trust training on a Group-wide basis to raise awareness and seek compliance with the WPP Code of Conduct.
Confidential, independently operated helpline for WPP staff to raise any concerns, which are investigated and reported to the Audit Committee on a regular basis.
Due diligence on acquisitions and on selecting and appointing suppliers and restrictions on the use of third party consultants in connection with any awards of client contracts.
Gift and hospitality register and approvals process.
|
|
The Group is subject to the laws of the US, the EU and other jurisdictions that impose sanctions and regulate the supply of services to certain countries.

|
Failure to comply with these laws could expose the Group to civil and criminal penalties including fines and the imposition of economic sanctions against the Group and reputational damage which could materially impact the Group’s results.
|
Online training on a Group-wide basis to raise awareness and seek compliance and updates to Group companies on any new sanctions.
Regular briefings to the Audit Committee and constant monitoring by the WPP legal team with assistance from external advisers of the sanctions regimes.
|
Longer-term viability statement
The directors confirm that they have a reasonable expectation that the Group will continue to operate and meet its liabilities, as they fall due, for the next three years. The directors’ assessment of the Group’s viability for the next three years, has been made with reference to the Group’s current position and prospects, the short-term notice periods or assignment nature of many of the client contracts, the volatility of global economic conditions, the changing competitive landscape and the Company’s ability to achieve the stated dividend policy and cover interest payments on the Group’s debt. This period has been chosen as it aligns with our three-year plan and budget. Sensitivity analysis has been applied to reflect the potential impact of one or a combination of the principal risks on the Group and consequential contract breach, loss of reputation, client loss and inability to win new business and the impact of revenue loss. Based on the results of this analysis and the assumption that the global economy and markets continue to function, the directors have a reasonable expectation that the Company will be able to continue in operation and meet its liabilities as they fall due over the three-year period of their assessment..
Going concern
The directors are required to consider whether it is appropriate to prepare the financial statements on the basis that the Company and the Group are going concerns. As part of its normal business practice, the Group prepares annual and longer-term plans and in reviewing this information and, in particular, the three-year plan and budget, the directors believe that the Company and the Group have adequate resources for the foreseeable future. Therefore the Company and the Group continue to adopt the going concern basis in preparing the financial statements.
Sustainability matters
The Group’s commitment to, and investment in, sustainability supports major business wins, increases access to talent, improves efficiency and reduces risks to our business. We estimate that clients who engaged with WPP on our approach to sustainability were worth over £1.6 billion in revenues to the Group in 2016, equivalent to over 11% of total revenues.
We are in business for the long term and, like all leading companies today, we recognise our wider responsibilities and the opportunity to generate value for share owners, clients, our people and the world at large through our business. Sustainability at WPP cuts across all areas: from the work we do for clients, to the time we donate to causes through pro bono work, the way we run our Company and look after our people, and our commitment to respect human rights.
It is the ability to create, recognise, refresh and maintain those long-term brand values that provide most big companies with their most reliable profit streams
Sustainability issues are ever more important to our clients as they adjust to the impact of long-term demographic, environmental and social trends, they need a marketing services provider who understands the changing landscape and shares their values. WPP companies are already advisors to pioneering businesses looking to embed sustainability and purpose into their brands, products and marketing and our own track record on sustainability gives us credibility.
A summary of the Group’s approach to sustainability can be found in the Sustainability review section. Please also see our annual Sustainability Report on the work our clients and our people do in this important area.
Sustainability performance summary
|
|
2016 |
2015 |
2014 |
| Value of client business supported by our sustainability credentials1 |
£1.64bn |
£1.29bn |
£1.35bn |
| Gender diversity (% female employees) |
54% |
54% |
54% |
| Gender diversity (% female executive leaders) |
34% |
33% |
31% |
| Investment in training |
£45.1m |
£41.1m |
£38.2m |
| Carbon footprint (tonnes of CO2 per employee) |
1.86 |
2.07 |
2.28 |
| Social contribution2,3 |
£42.3m |
£40.2m |
£46.9m |
And finally...
The business we are in demands that we be quick on our feet; quick to take advantage of new opportunities; quick to respond to new challenges; quick to understand new popular attitudes. 2016, more than any we can remember, was a year that made countless such demands.
But there is another skill, at least as important, that gets less recognition. It is less newsworthy, rarely draws attention to itself and is perhaps closer to wisdom. It is the ability to create, recognise, refresh and maintain those long-term brand values that provide most big companies with their most reliable profit streams. At a time when all external pressures seem to call for instant, short-term responses, an understanding of the value of confidence, consistency and continuity has never itself been more valuable.
It requires no less attentiveness and no less sensitivity to change in a market’s dynamics. But it knows when a gentle turn of the wheel is going to be far more favourable for a brand’s future than a dramatic change of course.
The results reported here are the outcome of tens of thousands of different client projects undertaken by tens of thousands of talented individuals working for a great diversity of companies within WPP. Some of these companies have yet to celebrate their fifth birthday; others are as old as their clients’ oldest brands. Increasingly, they work together.
We thank them all for another record-breaking year.
And the uncertainties of 2017 mean that we shall be more than ever grateful not only for their fleetness of foot, but also for the benefit of their considered thoughtfulness and accumulated experience.

Roberto Quarta
Chairman

Sir Martin Sorrell
Group chief executive

Paul Richardson
Group finance director
Forward-looking statements
In connection with the provisions of the Private Securities Litigation Reform Act of 1995 (the ‘Reform Act’), the Company may include forward-looking statements (as defined in the ‘Reform Act’) in oral or written public statements issued by or on behalf of the Company. These forward-looking statements may include, among other things, plans, objectives, projections and anticipated future economic performance based on assumptions and the like that are subject to risks and uncertainties. As such, actual results or outcomes may differ materially from those discussed in the forward-looking statements. Important factors which may cause actual results to differ include but are not limited to: the unanticipated loss of a material client or key personnel, delays or reductions in client advertising budgets, shifts in industry rates of compensation, regulatory compliance costs or litigation, natural disasters or acts of terrorism, the Company’s exposure to changes in the values of other major currencies (because a substantial portion of its revenues are derived and costs incurred outside of the UK) and the overall level of economic activity in the Company’s major markets (which varies depending on, among other things, regional, national and international political and economic conditions and government regulations in the world’s advertising markets). In addition, you should consider the risks described under the heading Principal risks and uncertainties in the Assessing and managing our risks section above, which could also cause actual results to differ from forward-looking information. In light of these and other uncertainties, the forward-looking statements included in this document should not be regarded as a representation by the Company that the Company’s plans and objectives will be achieved. The Company undertakes no obligation to update or revise any such forward-looking statements, whether as a result of new information, future events or otherwise.